KS2 Statistics Worksheets Football Reasoning
KS2 Statistics Worksheets on a Football Theme
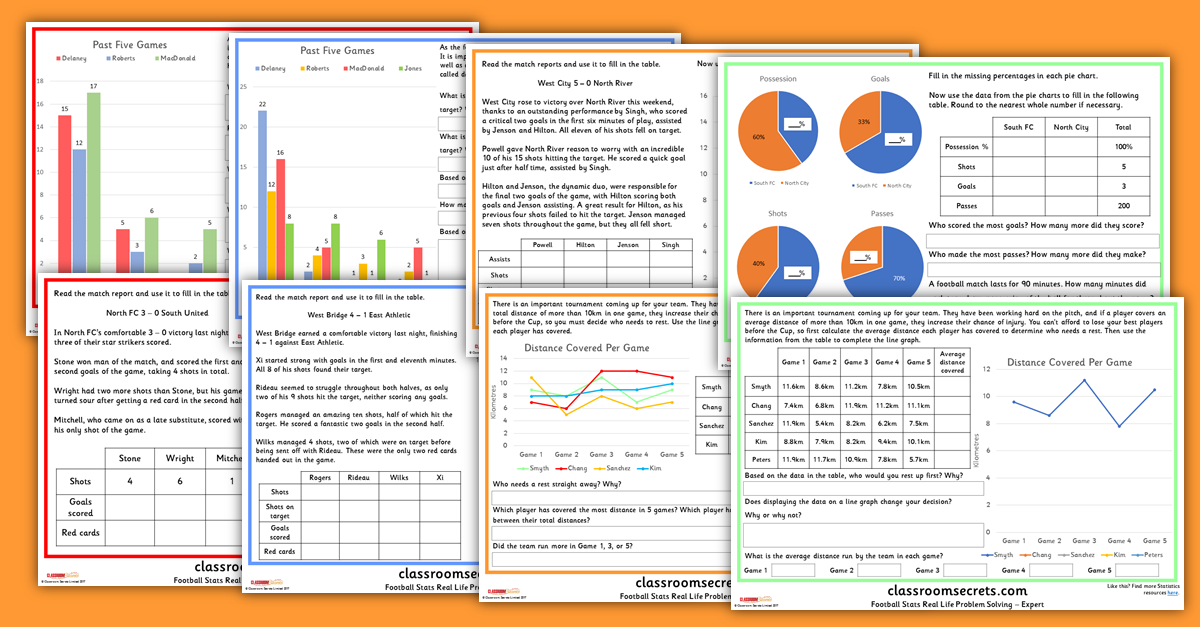
KS2 Statistics Worksheets with various tables, charts and graphs where children assume the role of football manager to manage the players in four differentiated levels.


Not a member? Sign up here.
[apss_share]
What's included in the pack?
This pack includes:
- KS2 Statistics Worksheets Football Reasoning Resource for Year 3, Year 4, Year 5 and Year 6 with answers.
National Curriculum Objectives
Mathematics Year 3: (3S1) Interpret and present data using bar charts, pictograms and tables; Solve one-step and two-step questions [for example, ‘How many more?’ and ‘How many fewer?’] using information presented in scaled bar charts and pictograms and tables
Mathematics Year 4: (4S2) Interpret and present discrete and continuous data using appropriate graphical methods, including bar charts and time graphs; Solve comparison, sum and difference problems using information presented in bar charts, pictograms, tables and other graphs
Mathematics Year 5: (5S2) Solve comparison, sum and difference problems using information presented in a line graph; complete, read and interpret information in tables, including timetables
Mathematics Year 6: (6S1) Interpret and construct pie charts and line graphs and use these to solve problems; calculate and interpret the mean as an average
Differentiation:
Beginner Interpret a simple bar chart and answer 5 questions. Use simple information to fill in a table and complete a bar chart. Aimed at Year 3 Secure/Year 4 Emerging.
Easy Interpret a bar chart and answer 5 questions including comparing information. Use given information to fill in a table and complete a bar chart. Aimed at Year 4 Secure/Year 5 Emerging.
Tricky Use given information to fill in a table and complete a bar chart. Interpret a line graph and use it to fill in a table. Find totals of sets of five numbers and answer 3 questions. Aimed at Year 5 Secure/Year 6 Emerging.
Expert Fill in missing data on four pie charts and a table. Answer three questions. Use information in table to complete line graph. Find averages of sets of five numbers and answer 2 questions. Aimed at Year 6 Secure.
This resource is available to download with a Premium subscription.