Mixed Age Year 3 and 4 Statistics Step 6 Resource Pack
Step 6: Mixed Age Year 3 and 4 Statistics Step 6 Resource Pack
Mixed Age Year 3 and 4 Statistics Step 6 Resource Pack includes a teaching PowerPoint and differentiated varied fluency and reasoning and problem solving resources for this step which covers Year 4 Line Graphs for Summer Block 2.


Not a member? Sign up here.
What's included in the Pack?
This Mixed Age Year 3 and 4 Statistics Step 6 pack includes:
- Mixed Age Year 3 and 4 Statistics Step 6 Teaching PowerPoint with examples.
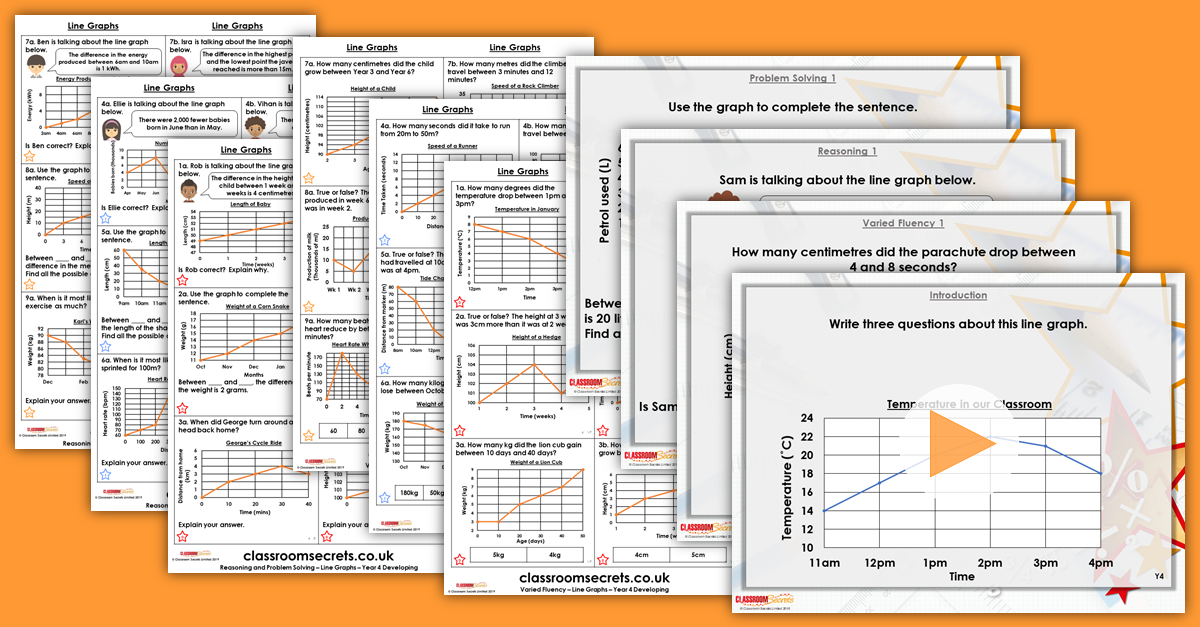
- Year 4 Line Graphs Varied Fluency with answers.
- Year 4 Line Graphs Reasoning and Problem Solving with answers.
National Curriculum Objectives
Mathematics Year 4: (4S1) Interpret and present discrete and continuous data using appropriate graphical methods, including bar charts and time graphs
Mathematics Year 4: (4S2) Solve comparison, sum and difference problems using information presented in bar charts, pictograms, tables and other graphs
Differentiation for Year 4 Line Graphs:
Varied Fluency
Developing Questions to support using line graphs to solve comparison, sum and difference problems, using increments of 1 on the y axis. Using up to 5 recordings per graph.
Expected Questions to support using line graphs to solve comparison, sum and difference problems, using multiples of 2 and 10 for scale intervals, with some use of half intervals. Using up to 8 recordings per graph.
Greater Depth Questions to support using line graphs to solve comparison, sum and difference problems, using multiples of 2, 5 and 10 for scale intervals, where not all increments are marked, use of half intervals. Using up to 8 recordings per graph.
Reasoning and Problem Solving
Questions 1, 4 and 7 (Reasoning)
Developing Explain if a statement about a line graph is correct or not, using increments of 1 on the y axis. Using up to 5 recordings per graph.
Expected Explain if a statement about a line graph is correct or not, using increments of 2 and 10 on the y axis, with some use of half intervals. Using up to 8 recordings per graph.
Greater Depth Explain if a statement about a line graph is correct or not, using increments of 2, 5 and 10 on the y axis, where not all increments are marked, use of half intervals. Using up to 8 recordings per graph.
Questions 2, 5 and 8 (Problem Solving)
Developing Find a given difference on a line graph, using increments of 1 on the y axis, with some use of half intervals. Using up to 8 recordings per graph.
Expected Find a given a difference on a line graph, using increments of 2 and 10 on the y axis, with some use of half intervals. Using up to 8 recordings per graph.
Greater Depth Find a given a difference on a line graph, using increments of 2, 5 and 10 on the y axis, where not all increments are marked, use of half intervals. Using up to 8 recordings per graph.
Questions 3, 6 and 9 (Reasoning)
Developing Find and explain a point on a graph where a change occurred, using increments of 1 on the y axis. Using up to 5 recordings per graph.
Expected Find and explain a point on a graph where a change occurred, using increments of 2 and 10 on the y axis, with some use of half intervals. Using up to 8 recordings per graph.
Greater Depth Find and explain a point on a graph where a change occurred, using increments of 2, 5 and 10 on the y axis, where not all increments are marked, use of half intervals. Using up to 8 recordings per graph.
This resource is available to download with a Premium subscription.