Pie Charts with Percentages Homework Extension Year 6 Statistics
Step 6: Pie Charts with Percentages Homework Extension Year 6 Summer Block 3
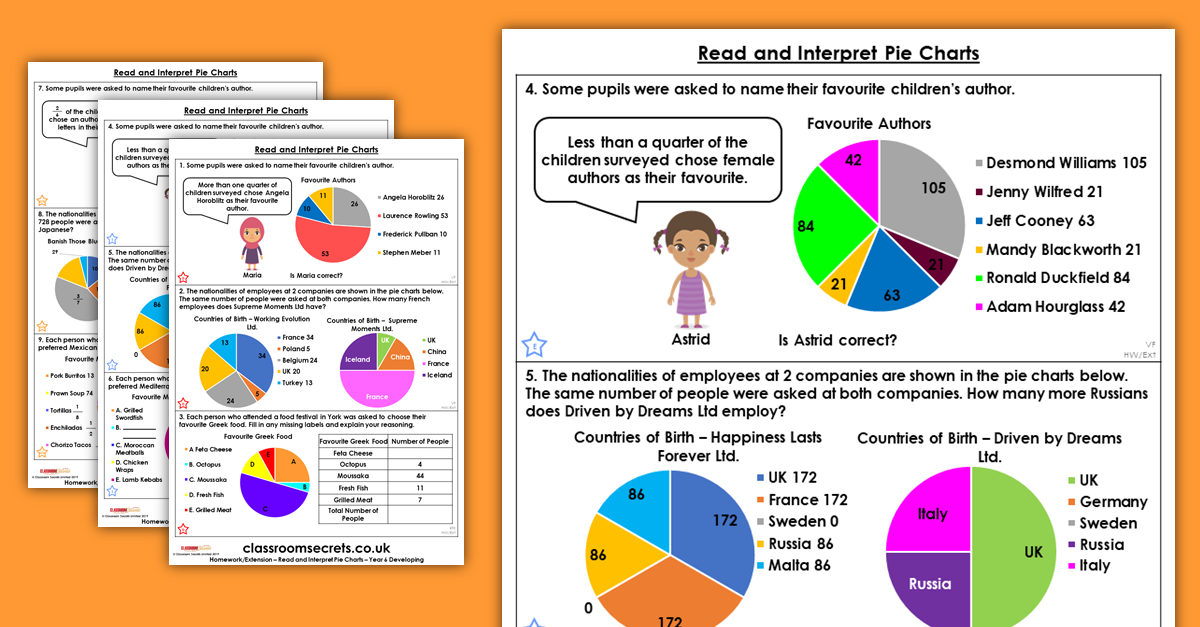
Pie Charts with Percentages Homework Extension provides additional questions which can be used as homework or an in-class extension for the Year 6 Pie Charts with Percentages Resource Pack. These are differentiated for Developing, Expected and Greater Depth.
More resources for Summer Block 3 Step 6.
Additional questions are available for Premium members.
What's included in the pack?
This pack includes:
- Pie Charts with Percentages Homework Extension with answers for Year 6 Summer Block 3.
National Curriculum Objectives
Mathematics Year 6: (6S1) Interpret and construct pie charts and line graphs and use these to solve problems
Differentiation:
Questions 1, 4 and 7 (Varied Fluency)
Developing Decide if a given statement is true or false, using data from a pie chart. 4 sets of data with multiples of 10%.
Expected Decide if a given statement is true or false, using data from a pie chart. 5 sets of data with multiples of 5%.
Greater Depth Decide if a given statement is true or false, using data from a pie chart. Two pie charts with 5 sets of data each, with any percentage.
Questions 2, 5 and 8 (Varied Fluency)
Developing Identify which child has interpreted the data from a pie chart correctly. 5 sets of data with multiples of 10%.
Expected Identify which child has interpreted the data from a pie chart correctly. 5 sets of data with multiples of 5%.
Greater Depth Identify which child has interpreted the data from a pie chart correctly. Two pie charts with 5 sets of data each, with any percentage.
Questions 3, 6 and 9 (Reasoning and Problem Solving)
Developing Fill in a missing percentage on a pie chart and use this and use this with other given information to calculate the number of children. 5 sets of data with multiples of 10%.
Expected Fill in a missing percentage on a pie chart and use this with other given information to calculate the number of children. 5 sets of data with multiples of 5%.
Greater Depth Fill in a missing percentage on each pie chart and use this and use this with other given information to calculate the number of children. Two pie charts with 5 sets of data each, with any percentage.
This resource is available to download with a Premium subscription.