Read and Interpret Pie Charts Homework Extension Year 6 Statistics
Step 5: Read and Interpret Pie Charts Homework Extension Year 6 Summer Block 3
Read and Interpret Pie Charts Homework Extension provides additional questions which can be used as homework or an in-class extension for the Year 6 Read and Interpret Pie Charts Resource Pack. These are differentiated for Developing, Expected and Greater Depth.
More resources for Summer Block 3 Step 5.
Additional questions are available for Premium members.
What's included in the pack?
This pack includes:
- Read and Interpret Pie Charts Homework Extension with answers for Year 6 Summer Block 3.
National Curriculum Objectives
Mathematics Year 6: (6S1) Interpret and construct pie charts and line graphs and use these to solve problems
Differentiation:
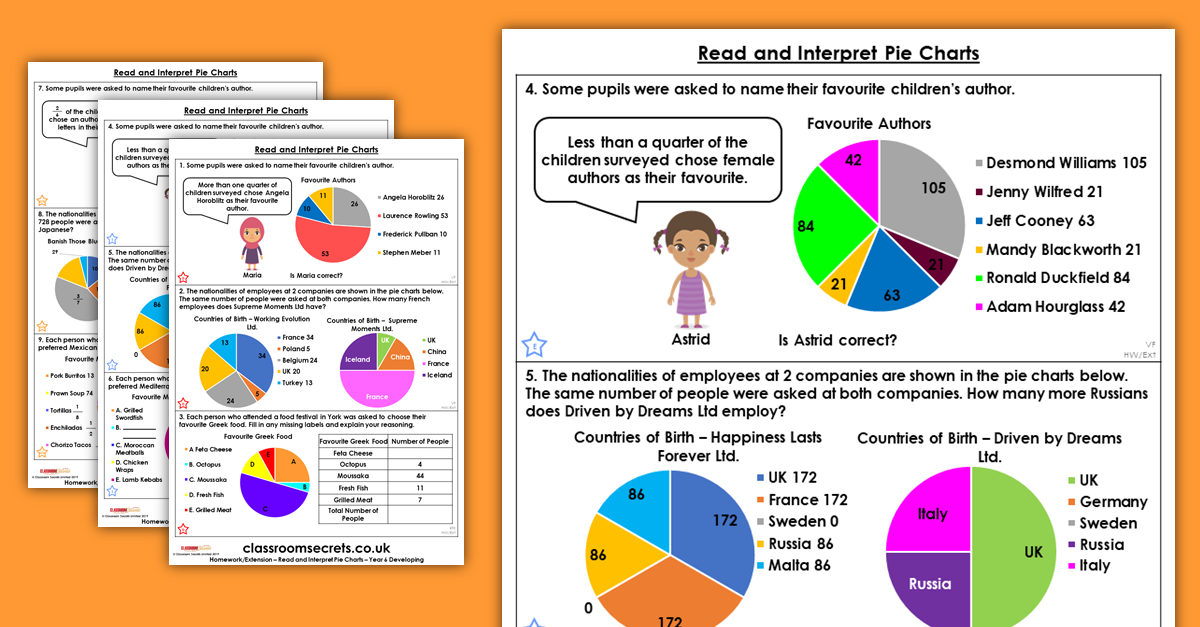
Questions 1, 4 and 7 (Varied Fluency)
Developing Decide whether a statement is correct. Using halves, thirds, quarters and fifths with numbers up to 100. Including up to 5 segments and up to 2 different denominators per chart.
Expected Decide whether a statement is correct. Using halves, quarters, eighths, fifths, thirds and sixths, with numbers up to 1000. Including up to 6 segments and up to 3 different denominators per chart, where all denominators are direct multiples.
Greater Depth Decide whether a statement is correct. Using any fraction, with numbers up to 1,000. Including up to 6 segments and up to 4 different denominators per chart, where denominators are not always direct multiples.
Questions 2, 5 and 8 (Varied Fluency)
Developing Compare two sets of data in a pie chart. Using the same criteria as in Q1.
Expected Compare two sets of data in a pie chart. Using the same criteria as in Q4.
Greater Depth Compare two sets of data in a pie chart. Using the same criteria as in Q7.
Questions 3, 6 and 9 (Reasoning and Problem Solving)
Developing Complete the missing labels in the table and pie chart. Using the same criteria as in Q1.
Expected Complete the missing labels in the table and pie chart. Using the same criteria as in Q4.
Greater Depth Complete the missing labels in the table and pie chart. Using the same criteria as in Q7.
This resource is available to download with a Premium subscription.