Loading resources
- Read and Interpret Pie Charts Lesson Slides

- Pie Charts with Percentages Lesson Slides
- Line Graphs Lesson Slides
- Line Graphs Lesson Slides 2

- Line Graphs Lesson Slides 3

- Statistics Consolidation Task

- Draw Pie Charts Reasoning and Problem Solving

- Draw Pie Charts Varied Fluency

- Pie Charts with Percentages Reasoning and Problem Solving

- Pie Charts with Percentages Varied Fluency

- Read and Interpret Pie Charts Fluency Matrix

- Read and Interpret Pie Charts Reasoning and Problem Solving

- Read and Interpret Pie Charts Varied Fluency

- Use Line Graphs to Solve Problems Reasoning and Problem Solving

- Use Line Graphs to Solve Problems Varied Fluency

- Draw Line Graphs Reasoning and Problem Solving

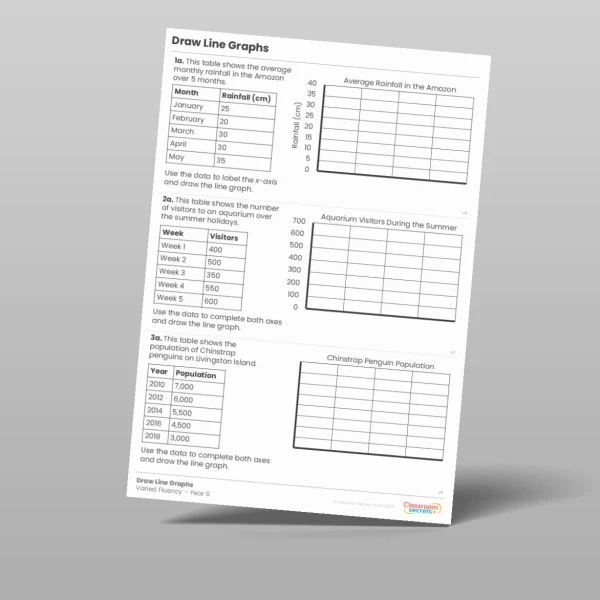
- Draw Line Graphs Varied Fluency
- Read and Interpret Line Graphs Fluency Matrix

- Read and Interpret Line Graphs Reasoning and Problem Solving

- Read and Interpret Line Graphs Varied Fluency

- Statistics Mistake Investigators

- Read and Interpret Pie Charts Modelling PPT

- Draw Line Graphs Teaching PPT

- Football Statistics Word Problems

- Matching Definitions Test Practice

- Read and Interpret Line Graphs Mixed Activity

- Statistics Consolidation Activity

- Dual Bar Charts Teaching PPT

- Read and Interpret Line Graphs Varied Fluency

- Read and Interpret Line Graphs Reasoning and Problem Solving

- Read and Interpret Line Graphs Homework

- Read and Interpret Line Graphs Discussion Problem
