Deepen understanding of how to use line graphs to solve problems by using this resource.
This Year 6 Use Line Graphs to Solve Problems Reasoning and Problem Solving worksheet helps children understand how to read data presented in line graphs to answer problems linked to calculating to find the total or difference between pieces of information. Questions gradually increase in challenge by the y-axis showing larger numbers and how much data is between intervals. Children will identify errors in reading line graphs, identify possible scenarios that could explain line graphs and examine how data can be interpreted. All answers are also included so that marking is as easy as possible!
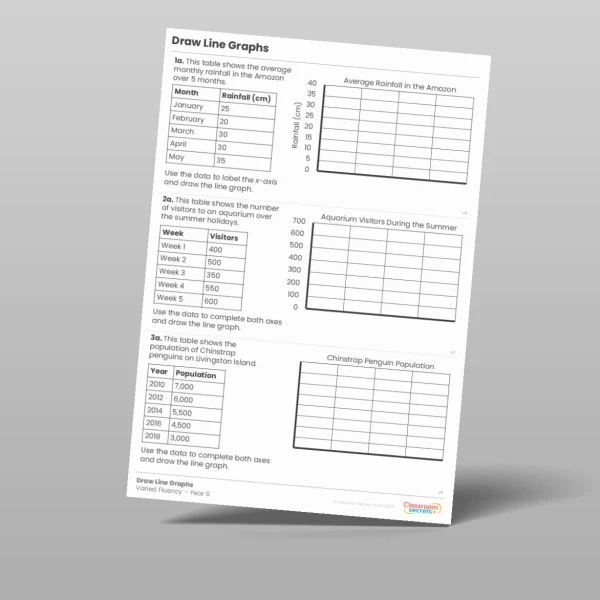
A varied fluency resource is also available for this small step, which uses many of the same line graphs in different contexts for familiarity.
Curriculum Objectives
- Interpret and construct pie charts and line graphs and use these to solve problems
Tags
Select a tag to view relevant resources
Summer
6S1
Statistics