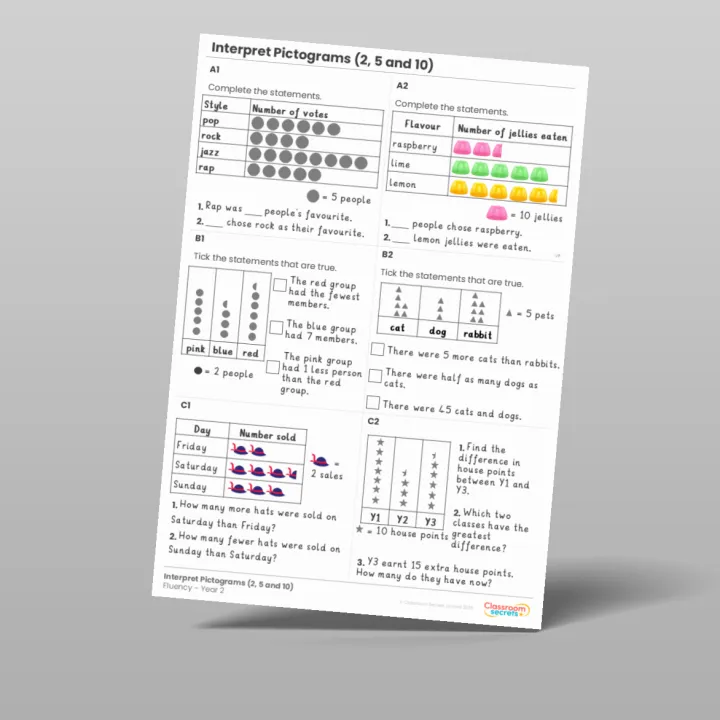
Year 2 Interpret Pictograms (2, 5 and 10)
(8 resources) View scheme
Download Zip
What's included?
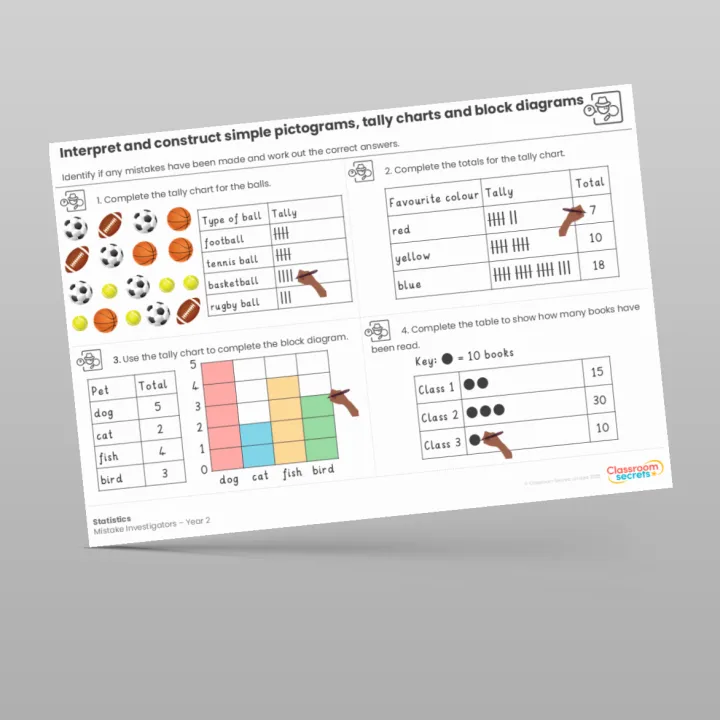
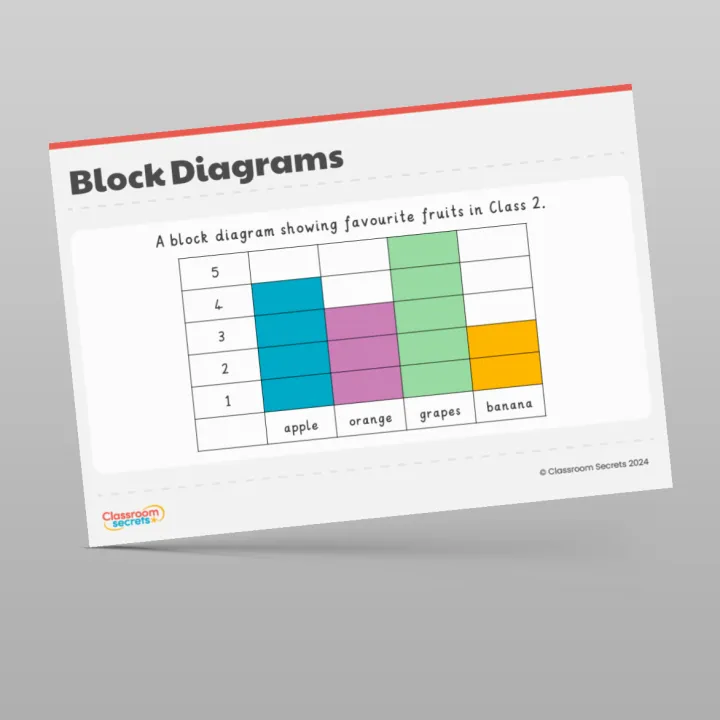
Challenging Year 2 resources for pupils to interpret pictograms (2, 5, and 10 ratio), answering questions based on the scaled data, a key KS1 Maths objective for data analysis. Activities build strong reasoning skills by requiring pupils to multiply and divide to extract data based on the key value. This crucial small step supports deepening understanding of statistics and is vital for national curriculum mastery. The CS Maths Scheme provides varied calculation and comparison tasks.
Full step description and curriculum objectives
Independent Tasks
Activities that help pupils practise, apply and secure their understanding after the main teaching input.
Block/Unit Resources
Materials that support and extend learning across the whole unit.

Resources at a glance
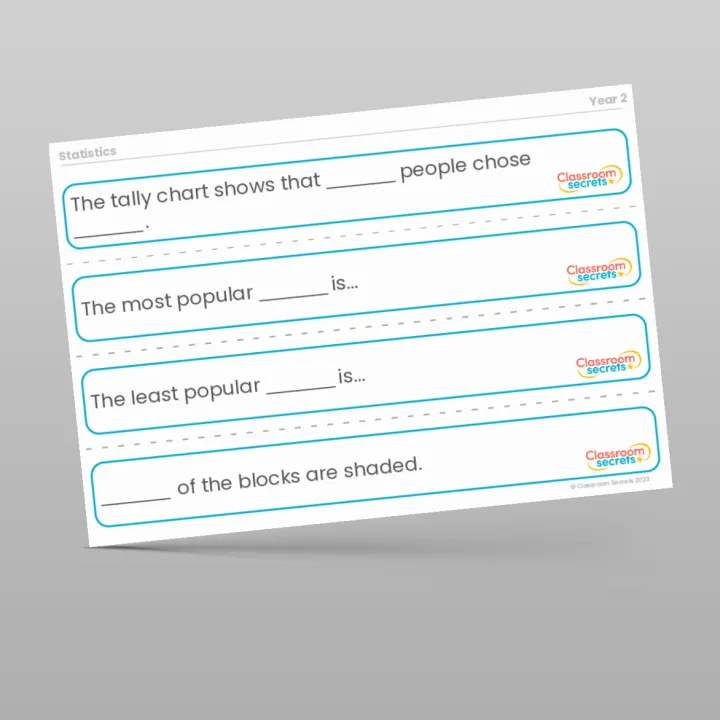
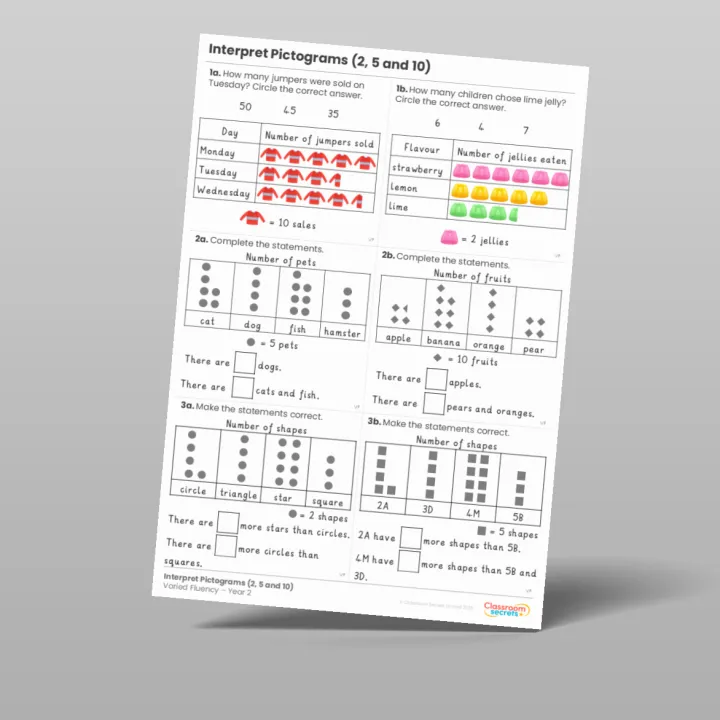
- WorksheetVaried FluencyConsolidate and secure understanding of key concepts with three fluency-based questions.
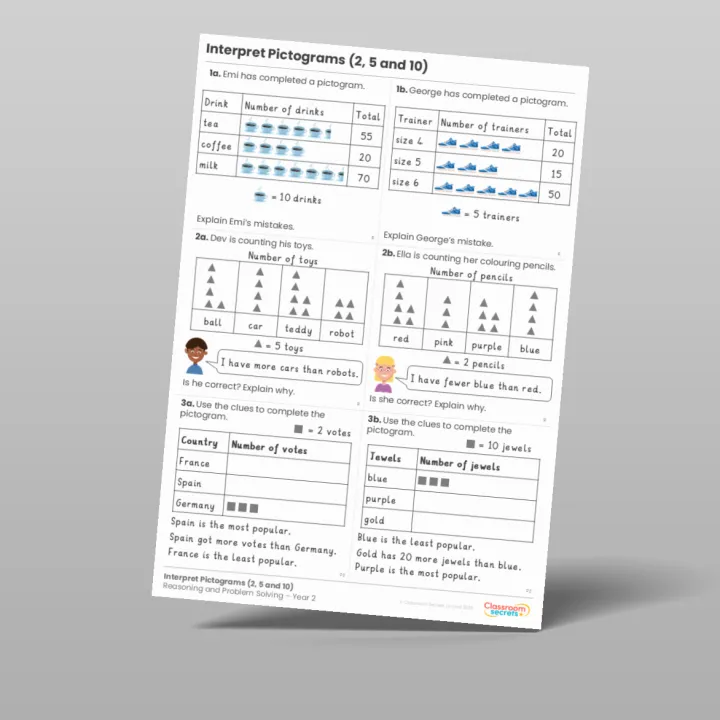
- WorksheetReasoning and Problem SolvingPromote mathematical reasoning and develop problem-solving skills with three different question types.
- WorksheetFluency MatrixMake learning more accessible by breaking down skills and concepts into smaller, more manageable steps.