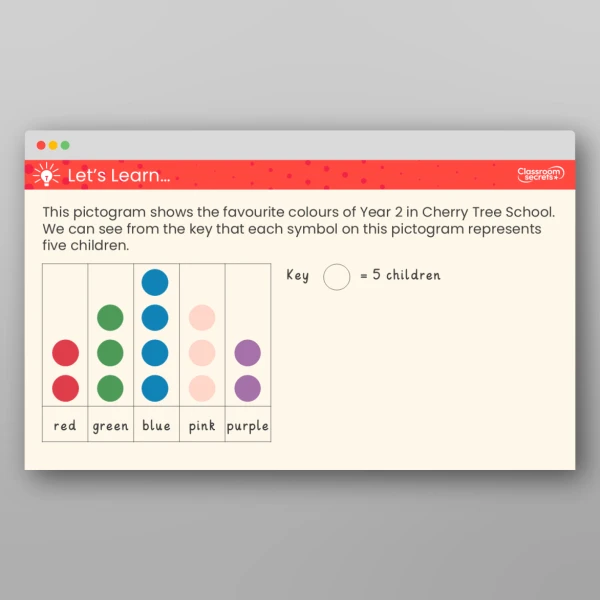
These Year 2 Interpret Pictograms (2, 5 and 10) Lesson Slides are designed to support your teaching of this objective. The slides are accompanied by a teacher explanation and have interactive questions embedded within to check understanding.
This resource is designed to align to White Rose Maths version 3. Classroom Secrets Limited is not affiliated with, endorsed by, or in any way connected to White Rose Education Limited. Our products are original to Classroom Secrets Limited and any reference to White Rose Maths is solely for the purpose of indicating compatibility and does not imply any association with White Rose Education.
Curriculum Objectives
- Interpret and construct simple pictograms, tally charts, block diagrams and simple tables
- Ask and answer simple questions by counting the number of objects in each category and sorting the categories by quantity
- Ask and answer questions about totalling and comparing categorical data
Tags
Select a tag to view relevant resources
Statistics
Summer
2S1
2S2a
2S2b