Graphic Organisers - Venn Diagrams
4th September 2025
Written by Chris Hyde
Welcome to the second blog in our series on graphic organisers!
Time to recap on what graphic organisers are via retrieval practice:
They are visual tools that break a topic down into its key areas and shows how they link together
They can be used across the curriculum
They are backed by research, such as in in multiple EEF Improving Literacy guidance reports, cited by The Bell Foundation as making curriculum content more accessible for EAL learners and endorsed by SENsible SENCo as a valuable aid for students with cognitive difficulties
They have the flexibility to be used throughout any lesson, such as whole-class discussions, plenaries, retrieval practice or group work for oracy and collaboration
This time, we are going to focus on Venn diagrams, which allow similarities and differences to be compared. An instantly-recognisable classic thanks to its overlapping circles, pupils can use it to explore what relationship is shared between two (or more) things and what makes them different. These build on the first graphic organiser blog about charts, which contrasts two items that share no similarities.
To make things easier to understand, here’s a Venn diagram that could crop it in Year 4 maths: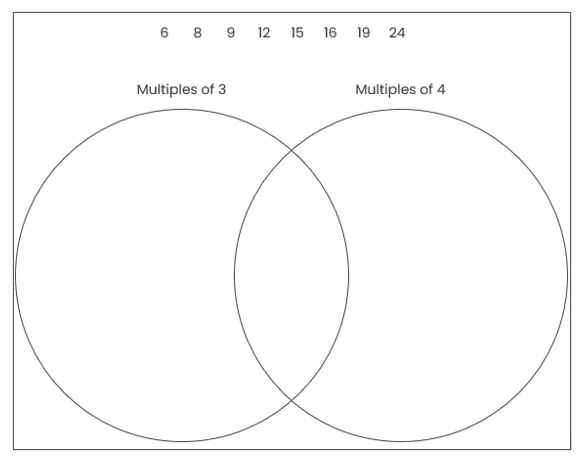
Fairly straightforward and you’ve probably already figured out how to complete that one correctly. But did you know that the different parts of a Venn diagram have names? Let’s make things a bit more technical…
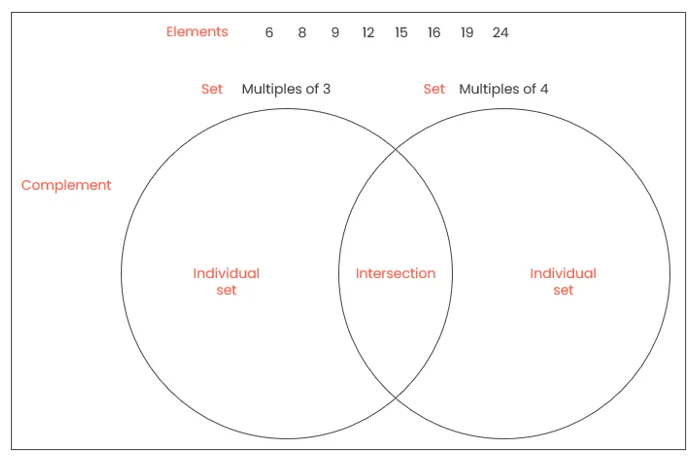
That got complicated rather quickly, didn’t it?!
This means that we can be more specific in our explanations about where elements go and (more importantly) why. For example, we know that 6 is a multiple of 3 but not a multiple of 4 so it would go into the left-hand individual set, whereas 16 is a multiple of 4 but not a multiple of 3 so it would go into the right-hand individual set. 12 goes into the intersection as it is a multiple of both numbers and therefore something that both sets have in common. 15 and 19 have been included in these elements as children often forget that there is a fourth place that data can be sorted within a Venn diagram – outside the circles, where elements that have features that don’t come under these sets are placed. This is a common misconception and something worth addressing if you use a Venn diagram. It is also important to remind pupils of reading the set names; if this Venn diagram had sets titled ‘two-digit numbers’ and ‘prime numbers’, the elements would be placed very differently.
Let’s get closure on that one before we move on:
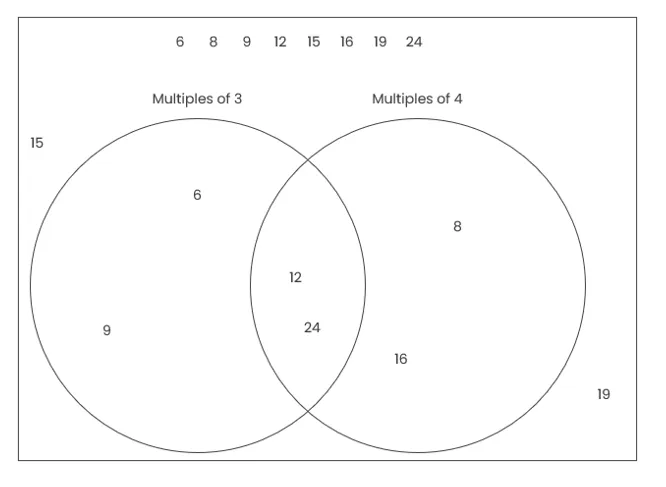
Note that there doesn’t have to be any order to the placement of numbers within the four sections; the important thing is that they are sorted into the correct section.
Venn diagrams sharpen analytic thinking and can be used across the entire curriculum beyond maths, such as:
English: comparing the personalities of two characters in a story;
Science: sorting materials that are waterproof and those that are flexible;
History: comparing the Tudor period to the present day;
Geography: comparing two deserts, such as the Chihuahua Desert and the Arctic;
Art: sorting similarities and differences between two pieces of art; and
Music: identifying what’s the same and what’s different between a piece of classical music and a jazz standard.
Rather than using words or numbers, images could be used (e.g. one set is called ‘lives on land’ and one set is called ‘lives in water’, with images of animals to glue into each individual set – where would an alligator, a guinea pig, an octopus and an eagle go?). You can also make things a bit more practical by using two big hoops (the sort generally found festering at the back of the PE cupboard) and making a large Venn diagram to sort actual items rather than written on pieces of paper, such as comparing different physical rock samples in science or the suitability of given materials for a purpose in DT.
There are other variations on the tried-and-tested two-circle iteration too, such as three (or more!) overlapping circles or three circles in a row where the central circle overlaps another on the left and another on the right (creating two separate intersections). Children could even be presented with a Venn diagram where the circles don’t overlap as the elements have no cross-over, such as ‘multiples of 2’ and ‘things that are blue’ – think of the deeper-level thinking this would create! John Venn, the 19th century English mathematician who developed these, would be proud.
Euler diagrams similarly use circles to represent relationships between sets but, due to being more complicated, might be a bit too mind-boggling for primary pupils. It is also worth mentioning that compare and contrast graphic organisers are available but these are Venn diagrams with a few cosmetic differences. Finally, there are also some cracking funny Venn diagrams available online if you ever need a pick-me-up after a particularly tough lesson!
These simple but powerful graphic organisers are a great way to support children to organise their thoughts. Click here to download an editable PowerPoint version, including several different models, to type the elements and sets in yourself or click here to download a PDF version that’s ready for you to print out and use.
Venn diagrams are a familiar yet powerful tool for helping pupils organise information, compare ideas and spot both similarities and differences. While they may seem simple at first glance, understanding the different parts of a Venn diagram – including the intersections and areas outside the sets – can lead to more precise thinking and reduce common misconceptions. Their use goes well beyond maths and they offer valuable opportunities across the curriculum. Whether using traditional two-circle diagrams or more complex variations, Venn diagrams encourage analytical thinking and deeper discussion. As graphic organisers, they remain a versatile and effective way to support learning in an engaging, visual way.
If this has sparked an idea on how you can use Venn diagrams to develop your pupils’ thinking, remember to let us know at hello@classroomsecrets.co.uk as we would love to hear all about it! Remember that the first in this series of blogs about graphic organisers is also online (charts); a third blog, all about Carroll diagrams, will be next.

Try us today!