Year 3 Interpret Bar Charts (Scale of 1)
(7 resources) View scheme
Download Zip
What's included?
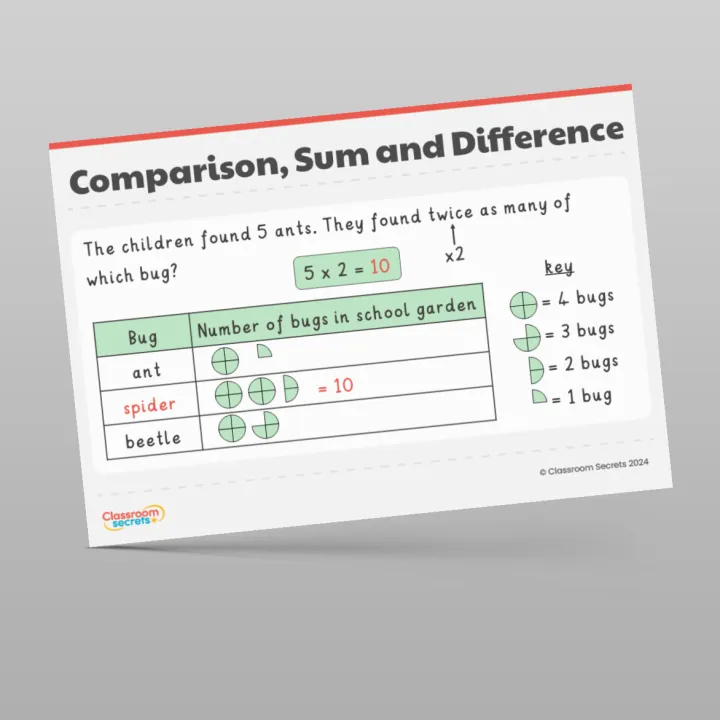
Dedicated Year 3 resources for pupils to interpret bar charts with a scale of 1, applying analysis skills to visual data, a core KS2 Maths objective. Activities build reasoning skills by requiring pupils to extract and compare data where one unit on the axis equals one item. This essential small step supports mastery of statistics and is vital for meeting national curriculum expectations. The CS Maths Scheme provides structured question tasks.
Full step description and curriculum objectives
Independent Tasks
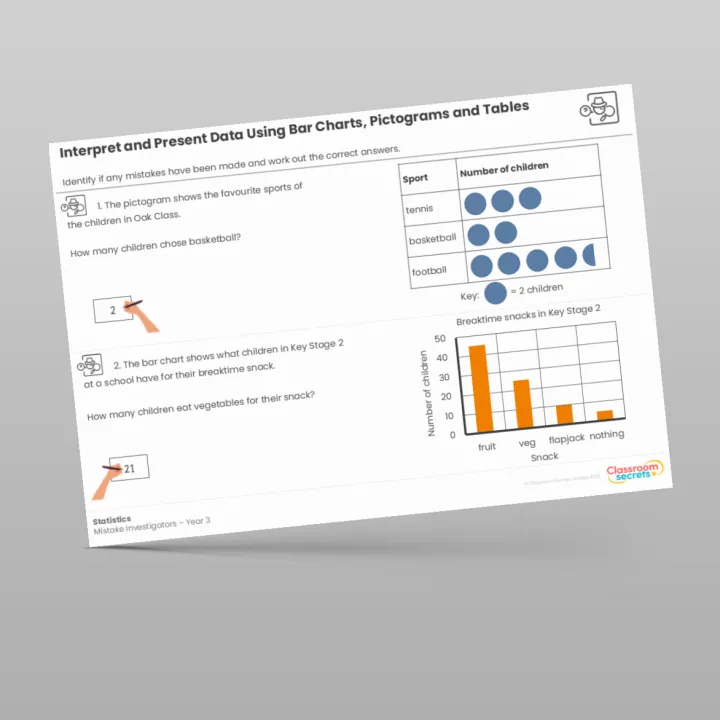
Activities that help pupils practise, apply and secure their understanding after the main teaching input.
Block/Unit Resources
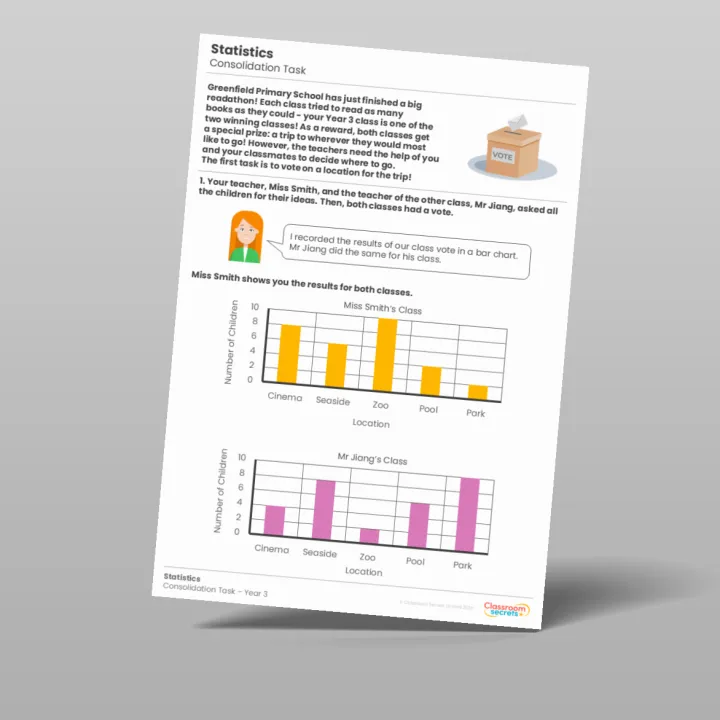
Materials that support and extend learning across the whole unit.
Resources at a glance
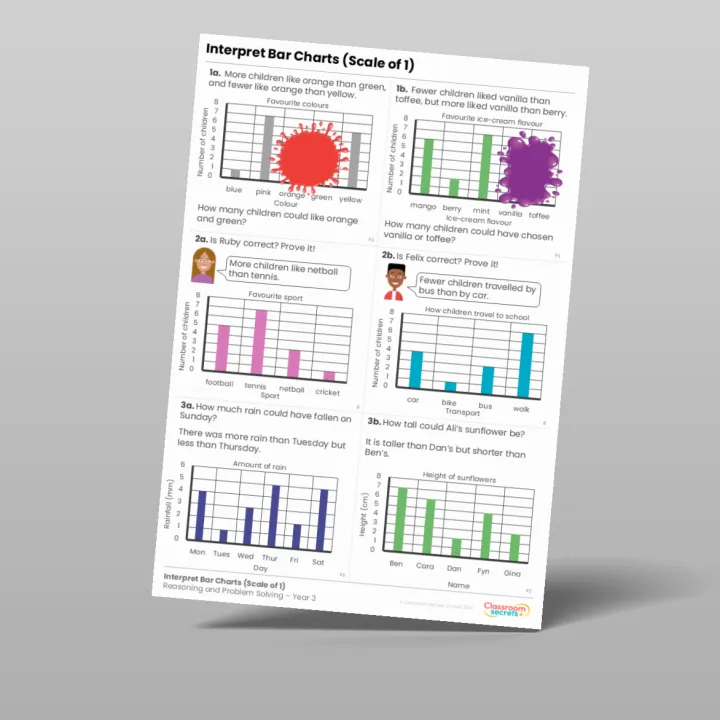
- WorksheetVaried FluencyConsolidate and secure understanding of key concepts with three fluency-based questions.
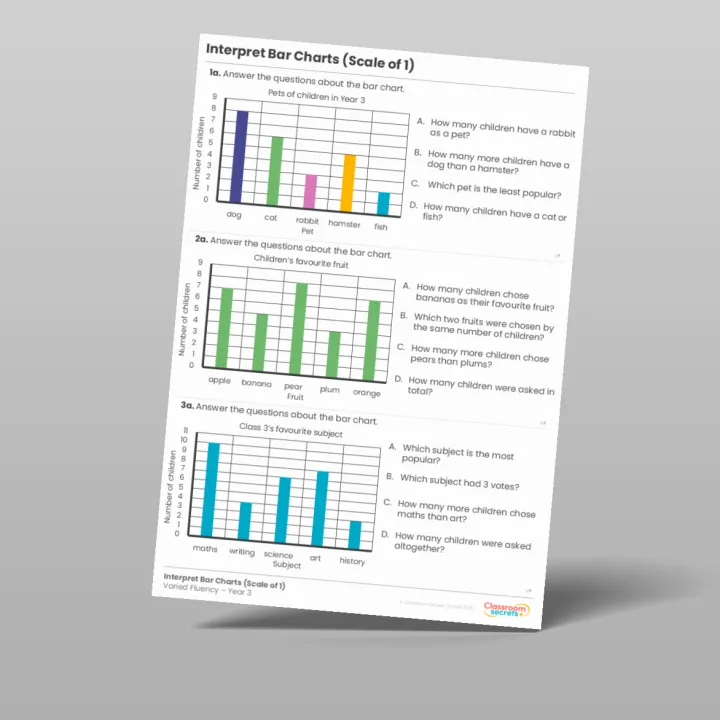
- WorksheetReasoning and Problem SolvingPromote mathematical reasoning and develop problem-solving skills with three different question types.