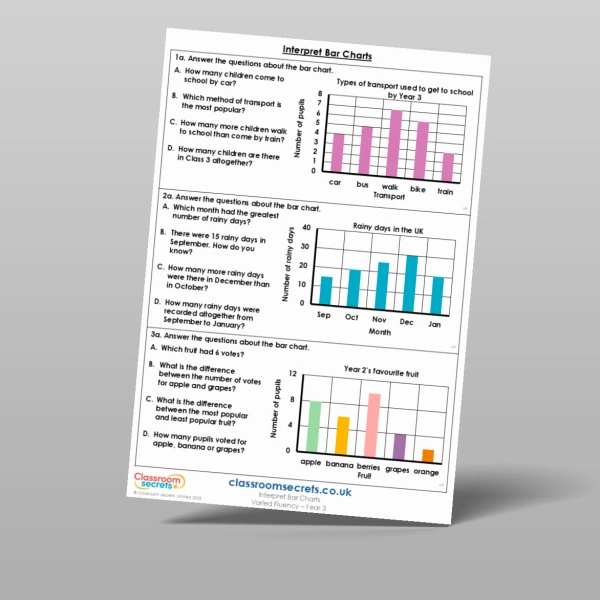
Children will be confident in answering questions about data with this Year 3 Interpret Bar Charts (Scale of 1) Varied Fluency worksheet. There are six questions for pupils to complete with a range of contexts given for each chart. Pupils will be required to total the data as well as finding how many more of two given entries. All answers are provided to encourage self-marking opportunities. Download now!
Curriculum Objectives
- Interpret and present data using bar charts, pictograms and tables
- Solve one-step and two-step questions [for example, ‘How many more?’ and ‘How many fewer?’] using information presented in scaled bar charts and pictograms and tables
Tags
Select a tag to view relevant resources
Summer
3S1
3S2
Statistics