Children can demonstrate their understanding of statistics with this Year 3 Interpret Bar Charts (Scale Greater than 1) Varied Fluency worksheet. There are six bar charts for pupils to answer questions about that use a variety of scales for the y-axis. All answers are provided to encourage peer and self-marking opportunities. Why not follow-up this activity with our reasoning and problem-solving worksheet for the same lesson? Download now!
Curriculum Objectives
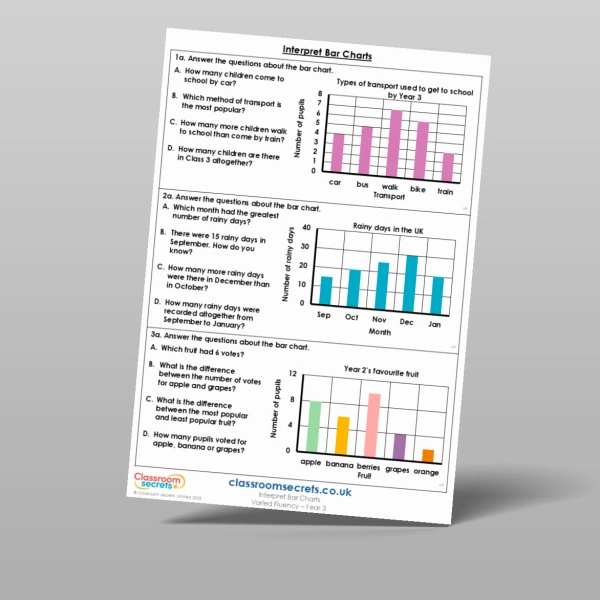
- Interpret and present data using bar charts, pictograms and tables
- Solve one-step and two-step questions [for example, ‘How many more?’ and ‘How many fewer?’] using information presented in scaled bar charts and pictograms and tables
Tags
Select a tag to view relevant resources
Summer
3S1
3S2
Statistics