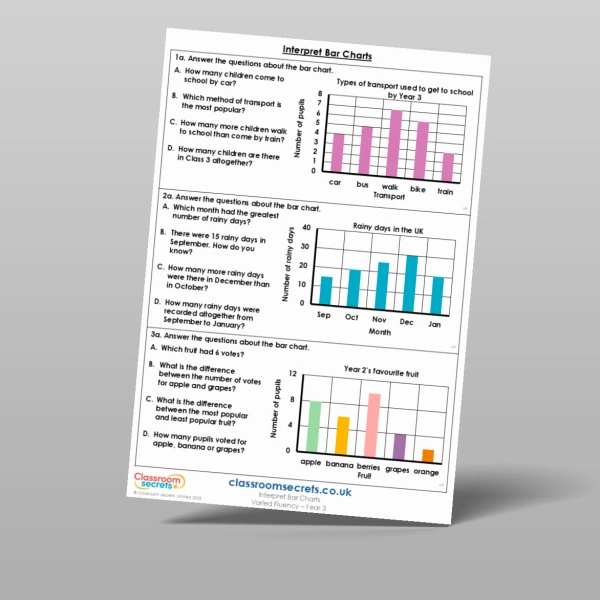
Develop children's understanding of collecting and representing data with this Year 4 Interpret Bar Charts (Recap) Varied Fluency worksheet. There are six engaging questions for pupils to complete including answering questions about the data, identifying the scale and adding the missing information. All answers are provided to encourage peer and self-assessment. Download now!
Curriculum Objectives
- Interpret and present discrete and continuous data using appropriate graphical methods, including bar charts and time graphs
Tags
Select a tag to view relevant resources
Summer
4S1
Statistics