Children can demonstrate their understanding of data collection with this Year 3 Interpret Bar Charts Fluency Matrix worksheet. There are six questions for pupils to complete and content is included from the lessons Year 3 Interpret Bar Charts (Scale of 1) and Interpret Bar Charts (Scale Greater than 1). The questions gradually increase in the level of challenge to ensure engagement and progression. All answers are provided to encourage peer and self-marking opportunities. Download today!
Curriculum Objectives
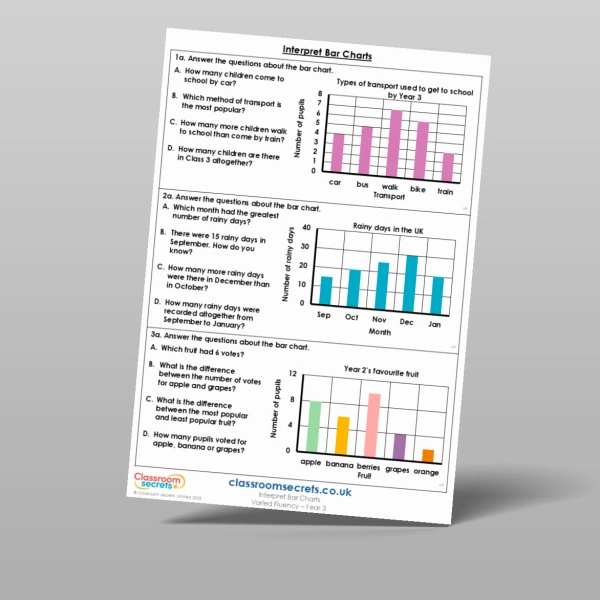
- Interpret and present data using bar charts, pictograms and tables
- Solve one-step and two-step questions [for example, ‘How many more?’ and ‘How many fewer?’] using information presented in scaled bar charts and pictograms and tables
Tags
Select a tag to view relevant resources
Summer
3S1
3S2
Statistics