Year 4 Present Data in Line Graphs
(8 resources) View scheme
Download Zip
What's included?
Practical Year 4 resources for pupils to present data in line graphs, applying graphing skills to continuous data, a core KS2 Maths objective for statistics. Activities build conceptual understanding of plotting points accurately and joining them to show trends. This essential small step supports mastery of data display and is vital for meeting national curriculum expectations. The CS Maths Scheme provides structured data graphing tasks.
Full step description and curriculum objectives
Independent Tasks
Activities that help pupils practise, apply and secure their understanding after the main teaching input.
Block/Unit Resources
Materials that support and extend learning across the whole unit.
Resources at a glance
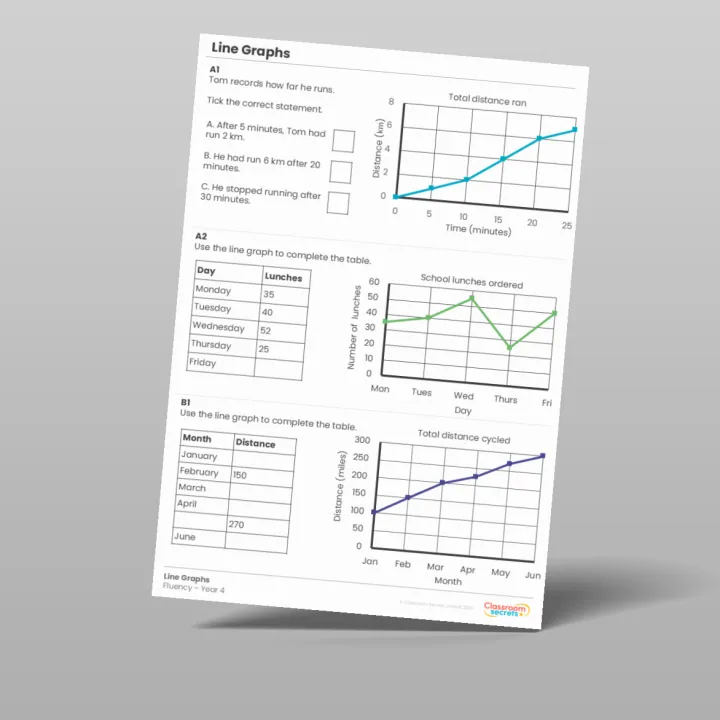
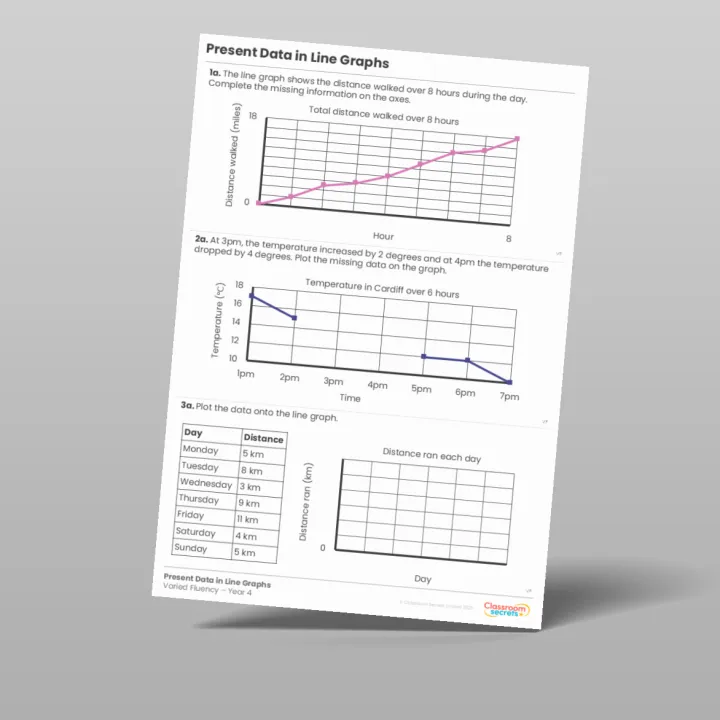
- WorksheetVaried FluencyConsolidate and secure understanding of key concepts with three fluency-based questions.
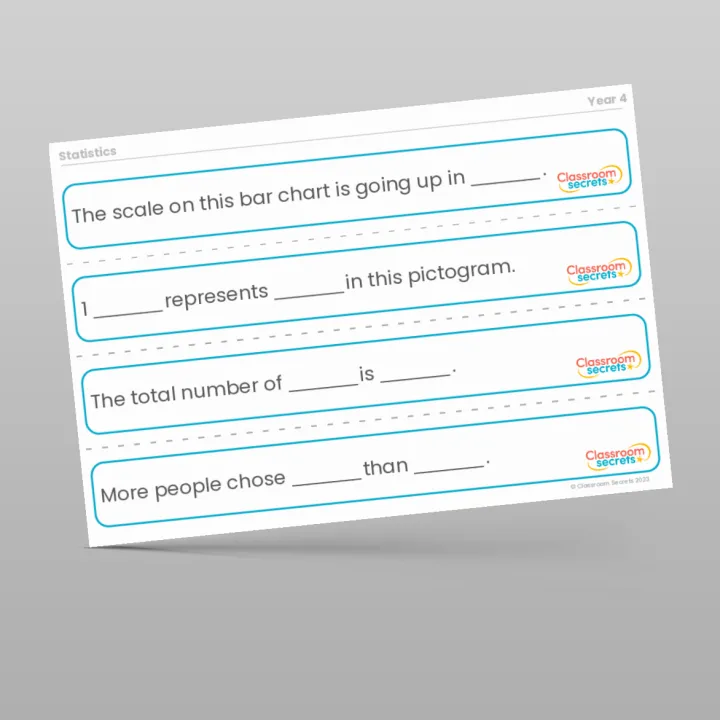
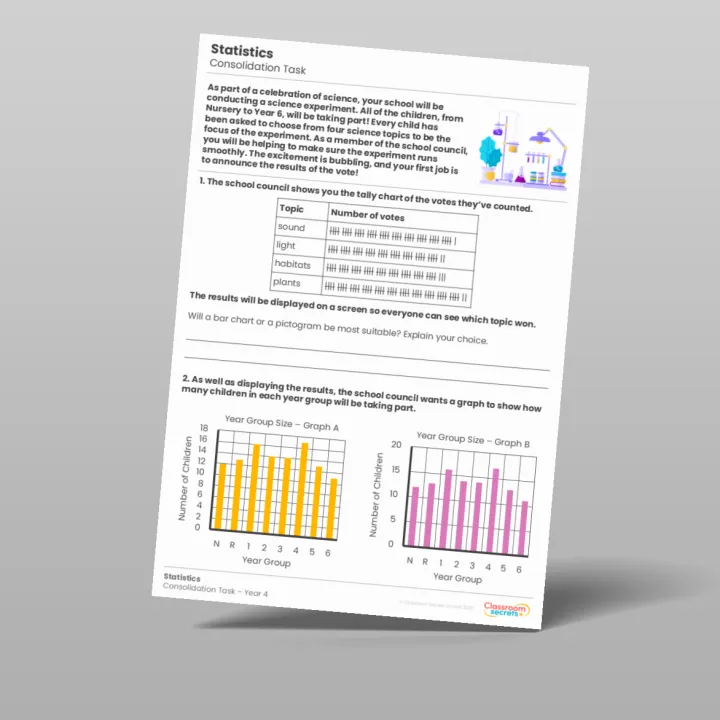
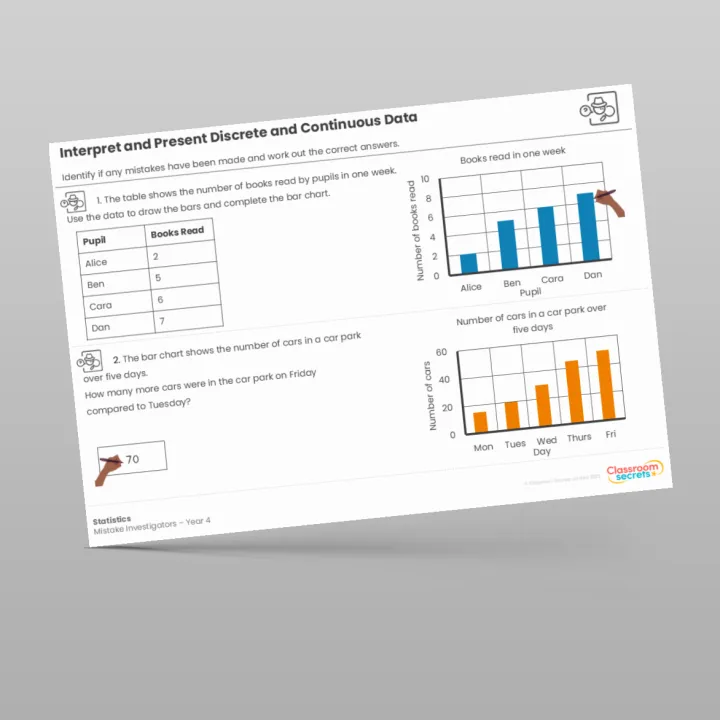
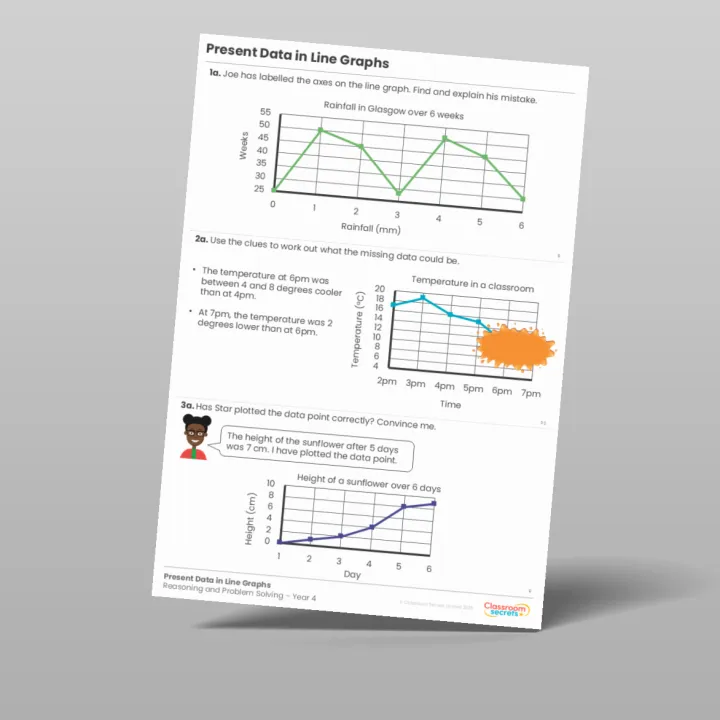
- WorksheetReasoning and Problem SolvingPromote mathematical reasoning and develop problem-solving skills with three different question types.
- WorksheetFluency MatrixMake learning more accessible by breaking down skills and concepts into smaller, more manageable steps.