Develop children's understanding of statistics with this Year 4 Present Data in Line Graphs Varied Fluency worksheet. There are six questions spread over two pages for pupils to complete including adding in the missing data and scales. All answers are provided to encourage peer or self-marking opportunities. Why not follow-up this activity with our reasoning and problem-solving worksheet for this lesson? Download now!
Curriculum Objectives
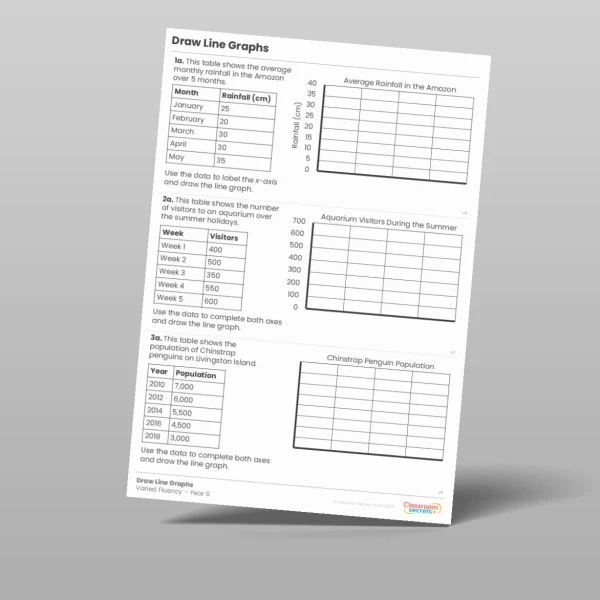
- Interpret and present discrete and continuous data using appropriate graphical methods, including bar charts and time graphs
Tags
Select a tag to view relevant resources
Summer
4S1
Statistics