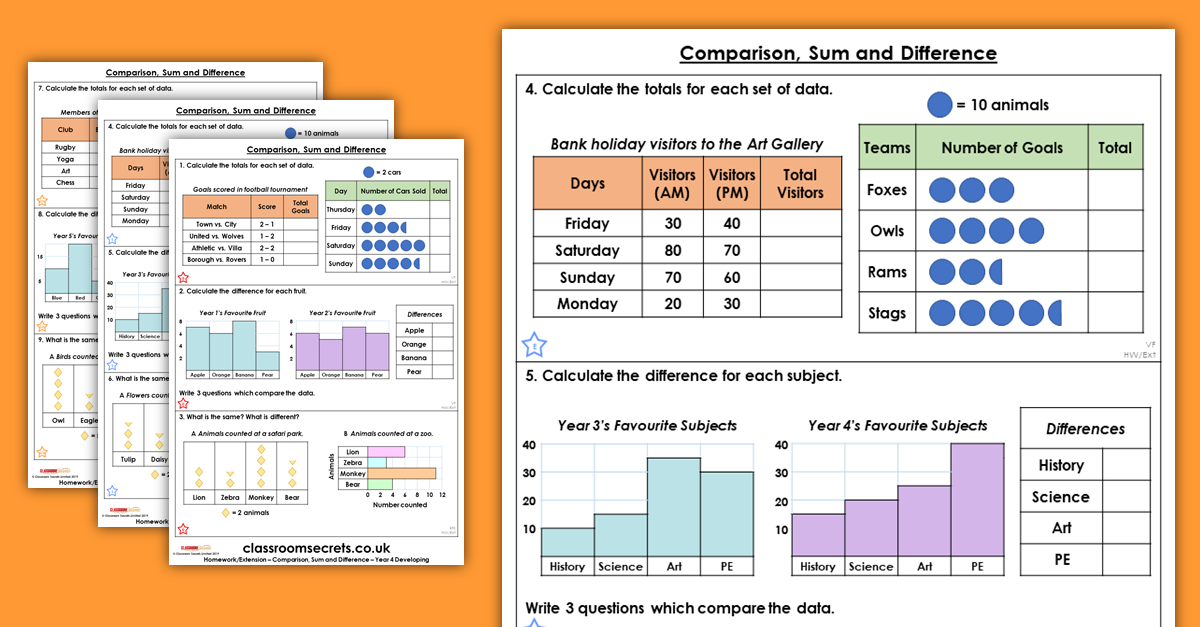
Comparison, Sum and Difference Homework Extension Year 4 Statistics

Step 2: Comparison, Sum and Difference Homework Extension Year 4 Summer Block 4
Comparison, Sum and Difference Homework Extension provides additional questions which can be used as homework or an in-class extension for the Year 4 Comparison, Sum and Difference Resource Pack. These are differentiated for Developing, Expected and Greater Depth.
More resources for Summer Block 4 Step 2.
Additional questions are available for Premium members.
What's included in the pack?
This pack includes:
- Comparison, Sum and Difference Homework Extension with answers for Year 4 Summer Block 4.
National Curriculum Objectives
Mathematics Year 4: (4S1) Interpret and present discrete and continuous data using appropriate graphical methods, including bar charts and time graphs
Mathematics Year 4: (4S2) Solve comparison, sum and difference problems using information presented in bar charts, pictograms, tables and other graphs
Differentiation:
Questions 1, 4 and 7 (Varied Fluency)
Developing Calculate the sum for each set of data. Includes pictograms, tables and bar charts using scale intervals of 1 or 2, with some use of half intervals. Uses a maximum of 4 sets of data.
Expected Calculate the sum for each set of data. Includes pictograms, tables and bar charts using multiples of 10 for scale intervals, with some use of half intervals. Uses a maximum of 4 sets of data.
Greater Depth Calculate the sum for each set of data. Includes pictograms, tally charts, tables and bar charts using multiples of 5 for scale intervals, where not all increments are marked and with some use of half intervals. Uses a maximum of 4 sets of data.
Questions 2, 5 and 8 (Varied Fluency)
Developing Calculate the differences between the data in bar charts. Write three questions about the data totals. Scale intervals and number of sets to match Question 1.
Expected Calculate the differences between the data in bar charts. Write three questions which compare the data. Scale intervals and number of sets to match Question 4.
Greater Depth Calculate the differences between the data in bar charts. Write three questions about the data. Scale intervals and number of sets to match Question 7.
Questions 3, 6 and 9 (Reasoning and Problem Solving)
Developing Explain what is the same and what is different about 2 sets of data. Chart types, scale intervals and number of sets to match Question 1.
Expected Explain what is the same and what is different about 2 sets of data. Chart types, scale intervals and number of sets to match Question 4.
Greater Depth Explain what is the same and what is different about 2 sets of data. Chart types, scale intervals and number of sets to match Question 7.
This resource is available to download with a Premium subscription.


