Free Interpret Charts Homework

Worksheet
Homework
FREE
x1
An image of the [object Object] Resource


What’s included in the Year 4 Interpret Charts Homework resource and why is it useful?

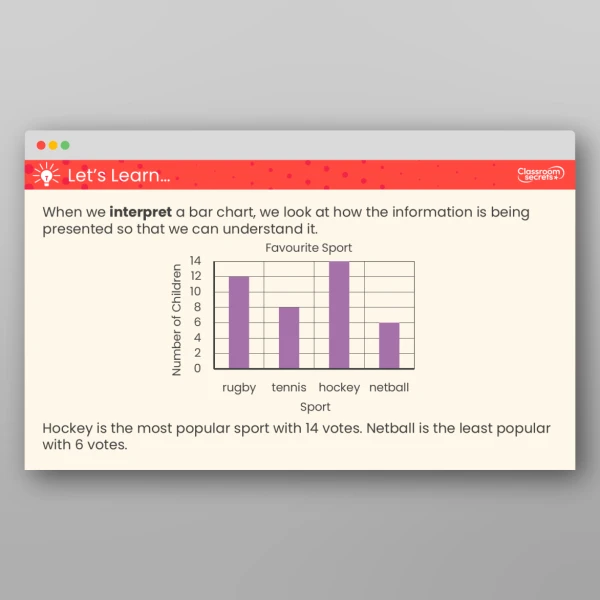
Year 4 Interpret Charts Homework is a set of worksheets to consolidate this step after it has been taught, at home or in class. Each set has been carefully designed to help you meet each child where they are at to ensure progress for every child, not just the average child. The content includes 3 levelled worksheets and a full answer sheet, covering interpreting pictograms and bar charts, spotting misinterpretations and presenting data.


Developing

  • Q1 identifying if a pictogram has been correctly converted into a bar chart, using 1:1 correspondence.
  • Q2 identifying a misinterpretation based on a bar chart, using 1:1 correspondence. Single step question.
  • Q3 explaining whether the presentation of information is most appropriate or not. Single step question.

Expected

  • Q4 identifying if a pictogram has been correctly converted into a bar chart, using 10:1 correspondence.
  • Q5 identifying a misinterpretation based on a bar chart, using 2:1 correspondence. Two step question.
  • Q6 explaining whether the presentation of information is most appropriate or not and how they would do it. Two step question.

Greater Depth

  • Q7 identifying if a pictogram has been correctly converted into a bar chart, using 3:1 correspondence.
  • Q8 identifying a misinterpretation based on a bar chart, using 4:1 correspondence. Multi step question.
  • Q9 explaining whether the presentation of information is most appropriate or not and how they would do it. Multi step question.

How do our maths homework resources work?

Our maths homework resources are not part of our adaptive maths resources, but they can be used alongside for consolidation purposes and to give children more opportunities to practise.


To teach this full step, head to Year 4 Interpret Charts lesson page.


This resource is designed to align to White Rose Maths version 3. Classroom Secrets Limited is not affiliated with, endorsed by, or in any way connected to White Rose Education Limited. Our products are original to Classroom Secrets Limited and any reference to White Rose Maths is solely for the purpose of indicating compatibility and does not imply any association with White Rose Education.


Curriculum Objectives

  • Interpret and present discrete and continuous data using appropriate graphical methods, including bar charts and time graphs
  • Solve comparison, sum and difference problems using information presented in bar charts, pictograms, tables and other graphs

Tags

Select a tag to view relevant resources

Summer

4S1

4S2

Statistics