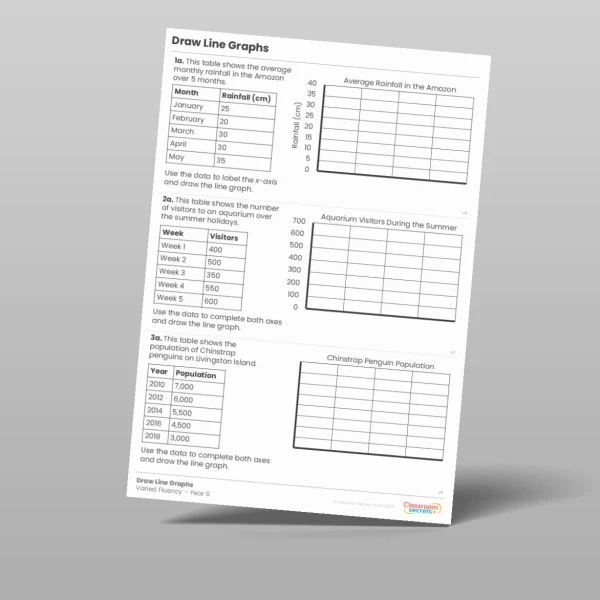
Draw Line Graphs Year 5 Statistics Learning Video Clip

Draw Line Graphs Learning Video Clip

Step 2: Draw Line Graphs Year 5 Statistics Learning Video Clip

Sandy and Coral Shaw are travelling to Penzance and need to use their knowledge of drawing line graphs on their holiday.

More resources for Autumn Block 3 Step 2.

Not a member? Sign up here.

Discussion points for teachers

1. Redraw this graph with a more suitable scale to show the data more clearly.
Discuss why the intervals are unsuitable. Discuss what difference changing the intervals might make. Discuss which intervals might be more suitable.


2. Create a graph based on the data provided.
Discuss the axis labels and the increments needed.


3. Complete the table and the graph to show the updated data.
Discuss how to work out the missing data to complete the graph.


4. Create a graph to show this using suitable intervals.
This question is open-ended for the children to explore. Discuss suitable intervals based on the total number of steps and how many steps each activity might take.

National Curriculum Objectives

Mathematics Year 5: (5S1) Complete, read and interpret information in tables, including timetables
Mathematics Year 5: (5S2) Solve comparison, sum and difference problems using information presented in a line graph

This resource is available to play with a Premium subscription.