Let us help support you with the teaching of bar charts when you download this Year 3 Bar Charts PowerPoint.
With a selection of varied fluency, reasoning and problem-solving questions available, this teaching resource can be worked through with your children at your own pace. Each question has been designed to help children consolidate and secure their knowledge and understanding of bar charts whilst challenging them to use and apply their reasoning and problem-solving skills.
This PowerPoint is ideal for whole-class teaching and works nicely in conjunction with our varied fluency, reasoning and problem-solving and discussion problem worksheets.
This resource is designed to align to White Rose Maths version 3. Classroom Secrets Limited is not affiliated with, endorsed by, or in any way connected to White Rose Education Limited. Our products are original to Classroom Secrets Limited and any reference to White Rose Maths is solely for the purpose of indicating compatibility and does not imply any association with White Rose Education.
Curriculum Objectives
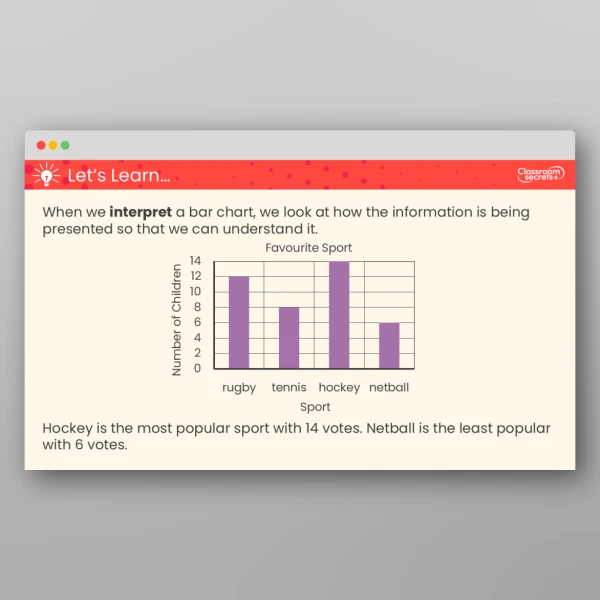
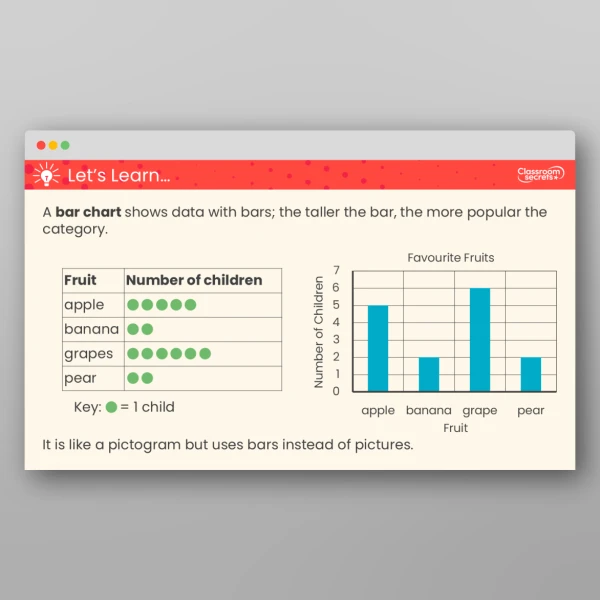
- Interpret and present data using bar charts, pictograms and tables
- Solve one-step and two-step questions [for example, ‘How many more?’ and ‘How many fewer?’] using information presented in scaled bar charts and pictograms and tables
Tags
Select a tag to view relevant resources
Statistics
Summer
3S1
3S2