Use this Year 3 Solve Problems using Statistics Reasoning and Problem Solving resource to give your class the chance to solve problems involving pictograms, bar charts and tables.
Each of the three questions presents children with information in a different way and asks them to either use it either to check a statement or to complete a data set according to the criteria given. Each question has two similar parts and these are spread across two pages. An answer page is provided on a third page for teachers, and children who may be marking their own work.
A varied fluency resource and a fluency matrix are also available for this small step.
Curriculum Objectives
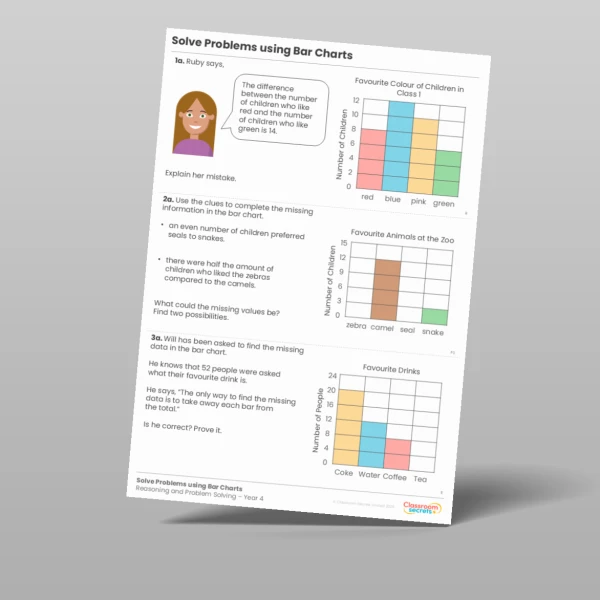
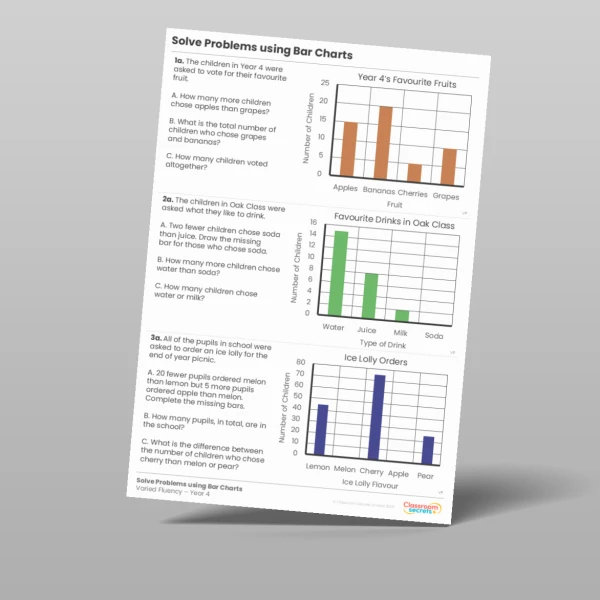
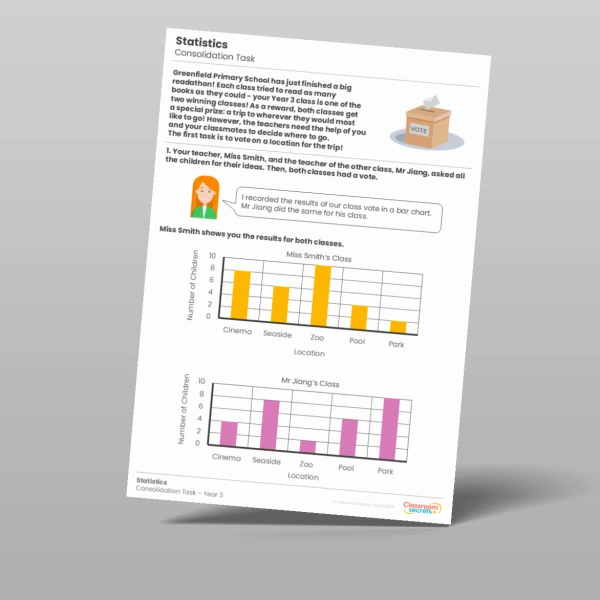
- Solve one-step and two-step questions [for example, ‘How many more?’ and ‘How many fewer?’] using information presented in scaled bar charts and pictograms and tables
Tags
Select a tag to view relevant resources
Summer
3S2
Statistics