Try our Modelling PowerPoint on Two-Way Tables to support your children with Y3 statistics.
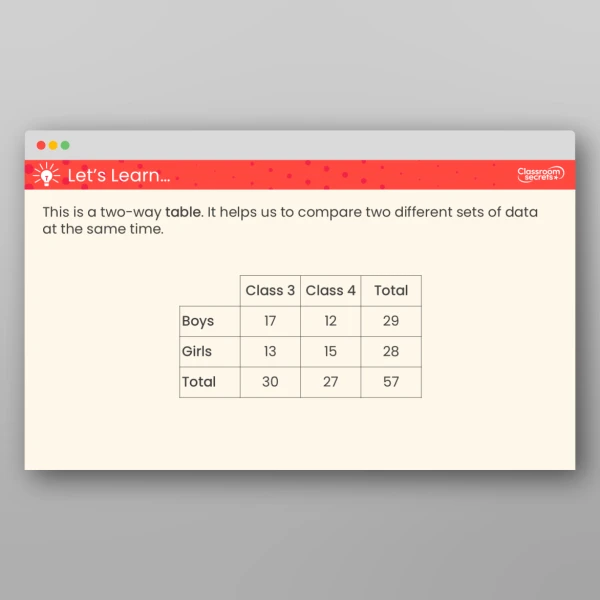
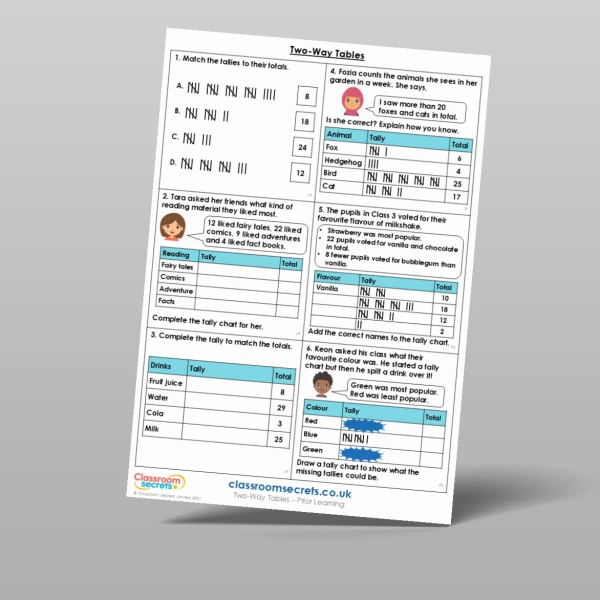
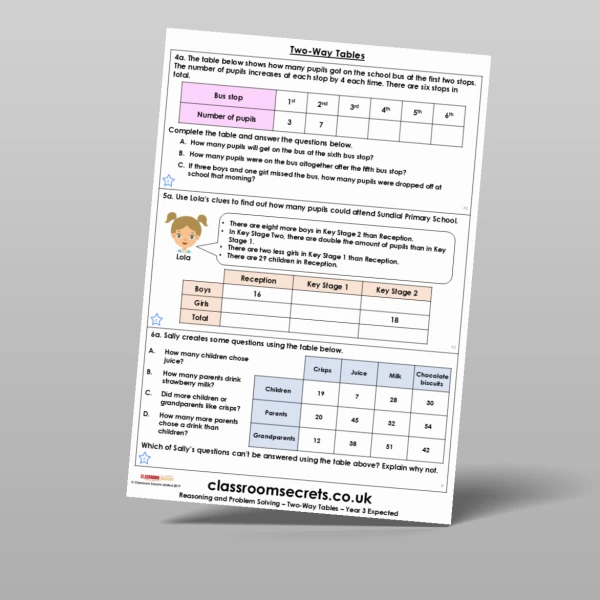
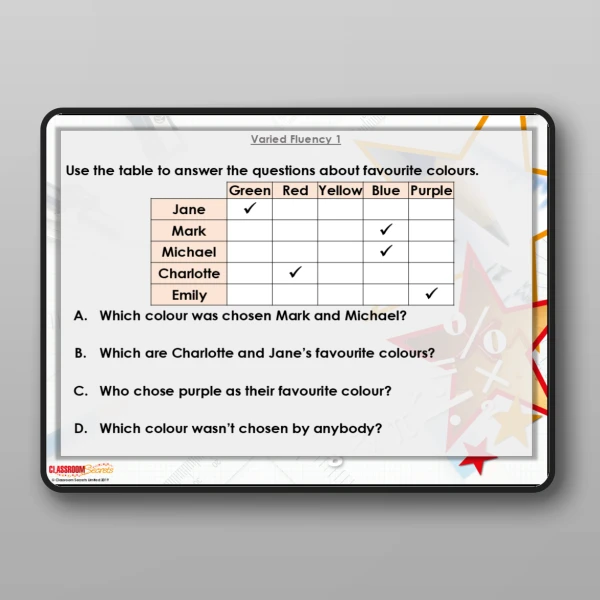
Our Year 3 Two-Way Tables resource allows you the chance to model and practise the skill of reading and interpreting tables.This modelling PowerPoint covers different varied fluency, reasoning and problem solving questions types as well as suitable answers for each question. Use this resource to support children in answering questions they might encounter on our varied fluency, reasoning and problem solving worksheets. Alternatively, this resource could be used as a recap of this objective in a small group or as a challenge activity to be displayed on your screens for children to test their knowledge once they've completed any independent learning task.
This resource is designed to align to White Rose Maths version 3. Classroom Secrets Limited is not affiliated with, endorsed by, or in any way connected to White Rose Education Limited. Our products are original to Classroom Secrets Limited and any reference to White Rose Maths is solely for the purpose of indicating compatibility and does not imply any association with White Rose Education.
Curriculum Objectives
- Interpret and present data using bar charts, pictograms and tables
- Solve one-step and two-step questions [for example, ‘How many more?’ and ‘How many fewer?’] using information presented in scaled bar charts and pictograms and tables
Tags
Select a tag to view relevant resources
Statistics
Summer
3S1
3S2