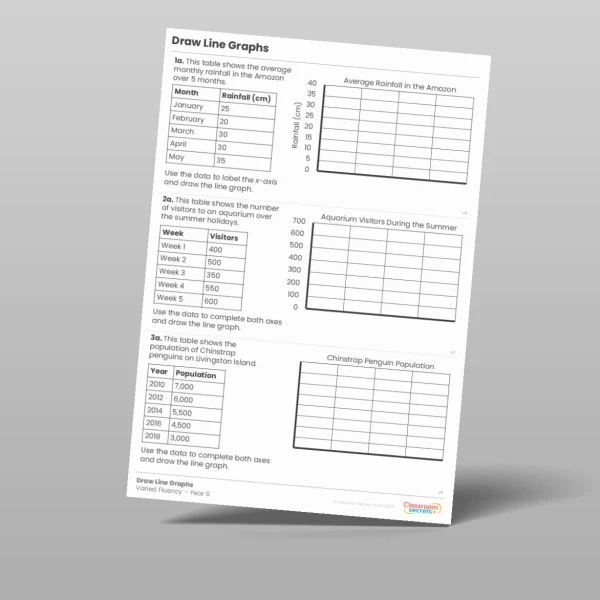
With this Year 6 Draw Line Graphs Mixed Activity, your children will have the opportunity to complete six questions about drawing line graphs. The resource includes three fluency questions, two reasoning and one problem solving question, so there's plenty for them to sink their teeth into. Download today to get access to this mixed worksheet.
Curriculum Objectives
- Interpret and construct pie charts and line graphs and use these to solve problems
Tags
Statistics
Spring
6S1