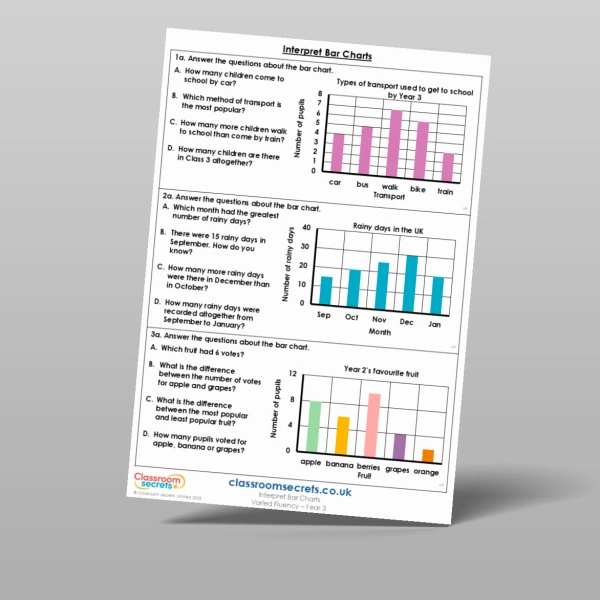
This Year 3 Bar Charts resource is made up of a variety of varied fluency and reasoning and problem-solving questions that help children get to the bottom of bar charts. There are six questions in total, three VF and three RPS, that are all based on the question types found on the main VF and RPS resources. An answer sheet has also been provided so that children can self-mark or peer mark, or to simply save you time yourself!
This resource is designed to align to White Rose Maths version 3. Classroom Secrets Limited is not affiliated with, endorsed by, or in any way connected to White Rose Education Limited. Our products are original to Classroom Secrets Limited and any reference to White Rose Maths is solely for the purpose of indicating compatibility and does not imply any association with White Rose Education.
Curriculum Objectives
- Interpret and present data using bar charts, pictograms and tables
- Solve one-step and two-step questions [for example, ‘How many more?’ and ‘How many fewer?’] using information presented in scaled bar charts and pictograms and tables
Tags
Select a tag to view relevant resources
Statistics
Summer
3S1
3S2