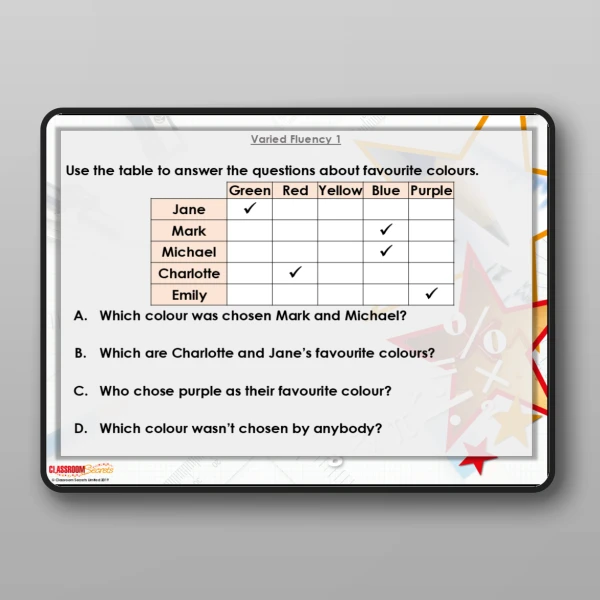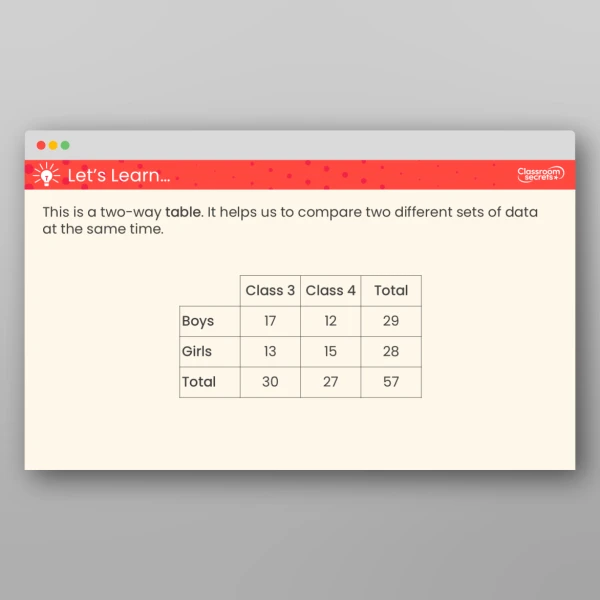
In this Year 3 Two-Way Tables Teaching PPT, children will learn how to interpret information shown in simple two-way tables. They will begin by exploring how these tables work, paying close attention to each row and column in turn, before progressing to answer targeted questions.
The content is organised into Let’s Learn sections, where new concepts and vocabulary are modelled, and Let’s Practise sections, where pupils can immediately apply their learning through short, focused activities.
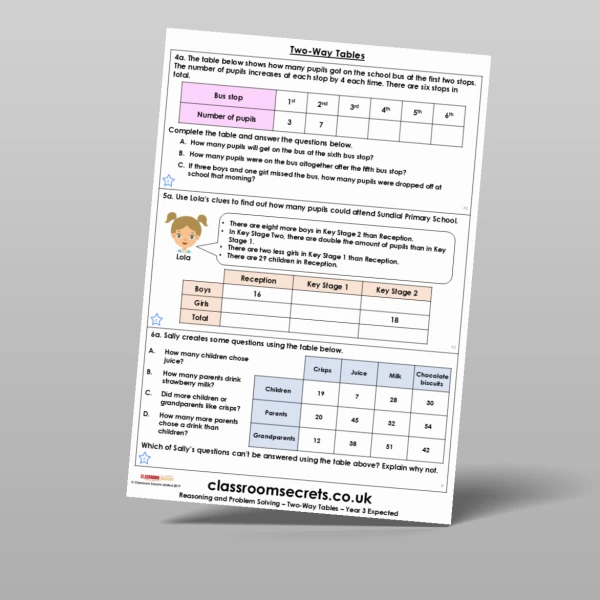
To deepen understanding, the PPT includes reasoning and problem-solving questions, giving children opportunities to apply their knowledge in different contexts.
The final slide provides links to additional resources to support this step - be sure to check them out!
Curriculum Objectives
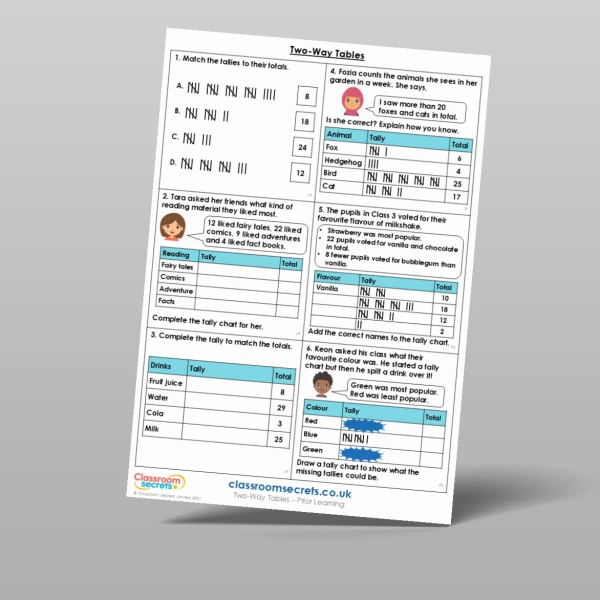
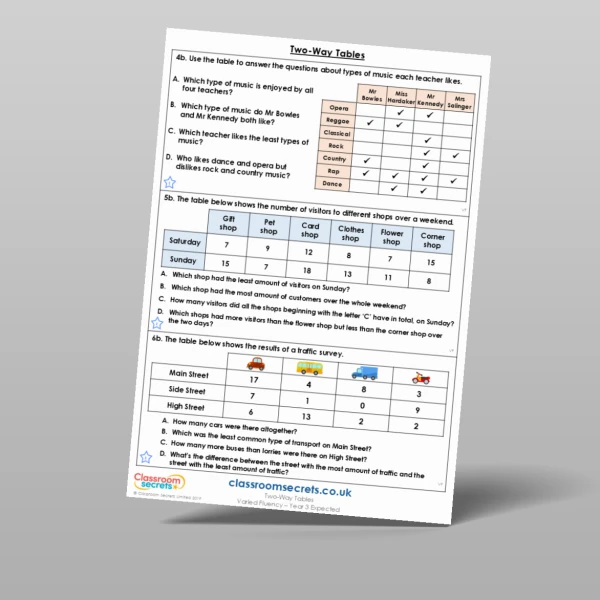
- Interpret and present data using bar charts, pictograms and tables
- Solve one-step and two-step questions [for example, ‘How many more?’ and ‘How many fewer?’] using information presented in scaled bar charts and pictograms and tables
Tags
Select a tag to view relevant resources
Statistics
Summer
3S1
3S2