Do you want children to experience interpreting data on different types of charts? Look no further than our Year 4 Interpret Charts Varied Fluency resource. This activity includes four different fluency style questions, with two of each type per worksheet. We've included three levels of differentiation to offer you both choice and challenge in your class.
Use as an independent activity in class after your teaching input. Alternatively, this can be used as a homework task, or form a tailored session as part of an intervention group; the choice is yours! We've made marking easy by including an answer page that can be used by you or the children. This resource works well alongside the other resources in this lesson too.
This resource is designed to align to White Rose Maths version 3. Classroom Secrets Limited is not affiliated with, endorsed by, or in any way connected to White Rose Education Limited. Our products are original to Classroom Secrets Limited and any reference to White Rose Maths is solely for the purpose of indicating compatibility and does not imply any association with White Rose Education.
Curriculum Objectives
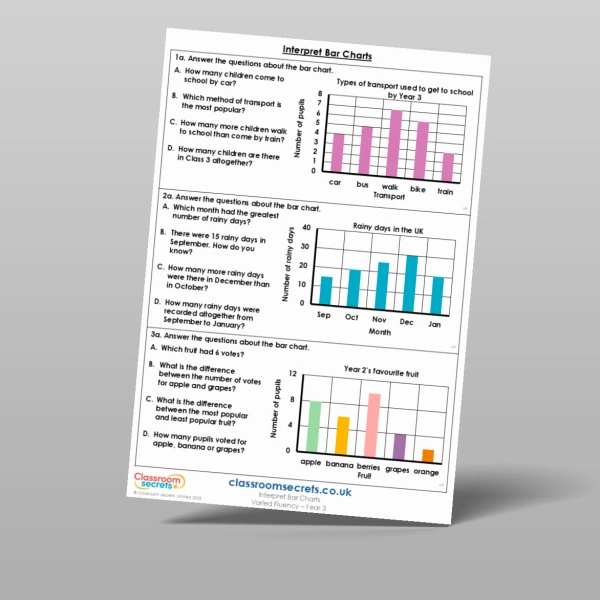
- Interpret and present discrete and continuous data using appropriate graphical methods, including bar charts and time graphs
- Solve comparison, sum and difference problems using information presented in bar charts, pictograms, tables and other graphs
Tags
Select a tag to view relevant resources
Statistics
Summer
4S1
4S2