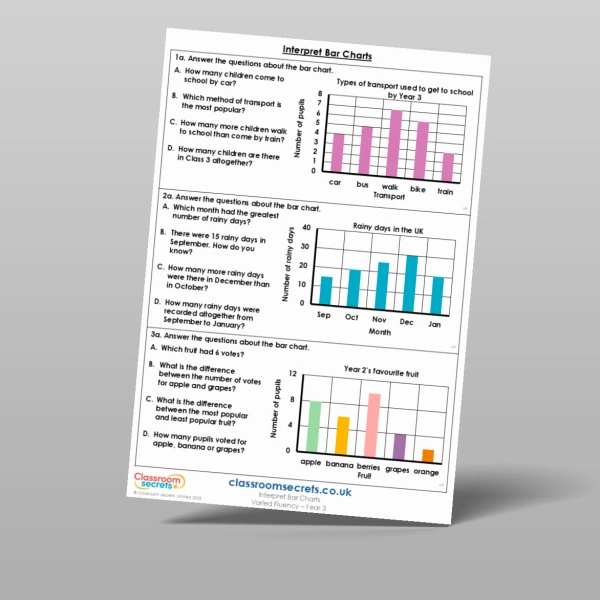
Teach statistics with this Year 6 Bar Charts worksheet. This resource contains six varied-fluency questions about interpreting bar charts. The pre-made dual bar charts contain scales of different increments and coloured keys to aid understanding. Print the worksheet in colour to make the most of this engaging resource.
This statistics resource is ideal for whole-class use as part of your main teaching. An answer sheet is also included for easy marking.
This resource is designed to align to White Rose Maths version 3. Classroom Secrets Limited is not affiliated with, endorsed by, or in any way connected to White Rose Education Limited. Our products are original to Classroom Secrets Limited and any reference to White Rose Maths is solely for the purpose of indicating compatibility and does not imply any association with White Rose Education.
Curriculum Objectives
- Interpret and present discrete and continuous data using appropriate graphical methods, including bar charts and time graphs
Tags
Select a tag to view relevant resources
Statistics
Spring
4S1