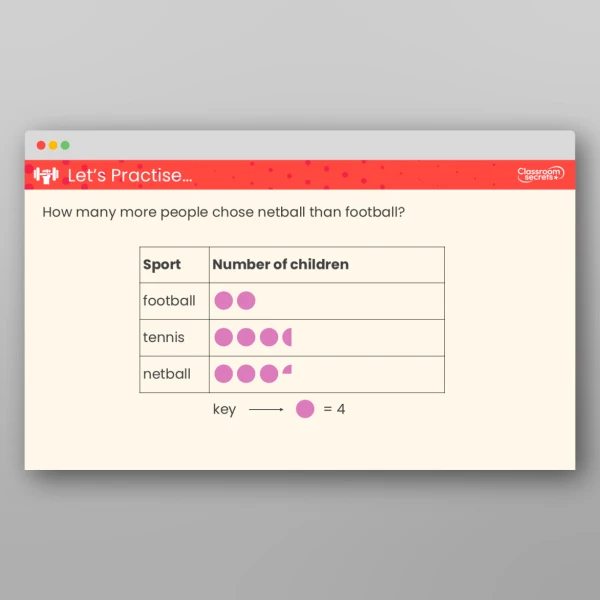
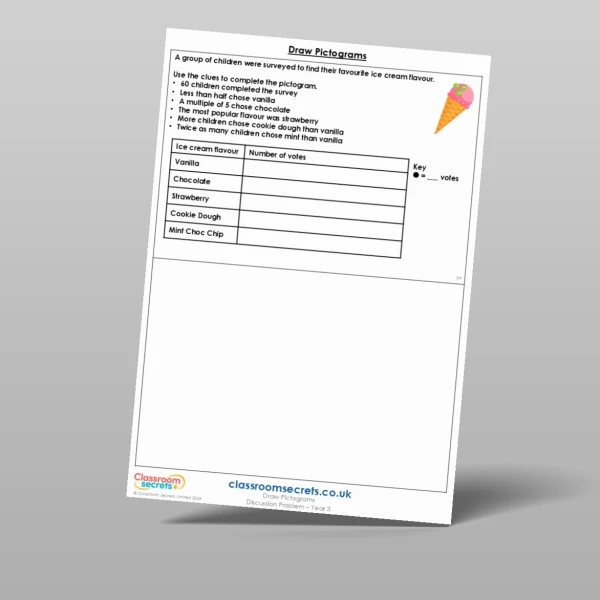
Pictograms Year 3 Statistics Free Resource Pack

Pictograms Year 3 Resources

Step 1: Pictograms Year 3 Spring Block 3 Resources

Pictograms Year 3 Resource Pack includes a teaching PowerPoint and differentiated varied fluency and reasoning and problem solving resources for Spring Block 3.

What's included in the pack?

This pack includes:

  • Pictograms Year 3 Teaching PowerPoint.
  • Pictograms Year 3 Varied Fluency with answers.
  • Pictograms Year 3 Reasoning and Problem Solving with answers.


National Curriculum Objectives

Mathematics Year 3: (3S1) Interpret and present data using bar charts, pictograms and tables

Mathematics Year 3: (3S2) Solve one-step and two-step questions [for example, ‘How many more?’ and ‘How many fewer?’] using information presented in scaled bar charts and pictograms and tables

Differentiation for Year 3 Pictograms:

Varied Fluency
Developing Questions to support reading and interpreting of pictograms, using values of 1, 2, 5 or 10. No half pictures.​
Expected Questions to support reading and interpreting of pictograms, using various values. Each image represents the same value within one graph, including half pictures.​
Greater Depth Questions to support reading and interpreting of pictograms, using various values. Different values represented within one pictogram, including half and quarter pictures. Values are not always given.

Reasoning and Problem Solving
Questions 1, 4 and 7 (Reasoning)
Developing Explain if the statement is correct when describing the pictogram. Images represented with the same value of 1 or 2 with no half pictures.
Expected Explain if the statement is correct when describing the pictogram. Images represented with the same value, including half pictures.
Greater Depth Explain if the statement is correct when describing the pictogram. Different images represented with different values. Pictogram includes half and quarter pictures.

Questions 2, 5 and 8 (Problem Solving)
Developing Use the clues to work out how many images could be missing from the pictogram. Images represented with the same value of 5 or 10 with no half pictures.
Expected Use the clues to work out how many images could be missing from the pictogram. Images represented with the same value, including half pictures.
Greater Depth Use the clues to work out how many images could be missing from the pictogram. Different images represented with different values. Pictogram includes half and quarter pictures.

Questions 3, 6 and 9 (Reasoning)
Developing Use the pictogram to explain whether the statement is correct. Images represented with the same value of 5 or 10 with no half pictures.
Expected Use the pictogram to explain whether the statement is correct. Images represented with the same value, including half pictures.
Greater Depth Calculate the value of each image and complete the pictogram. Justify if the statement is correct. Pictogram includes different images with no values given.

This resource is available to download with a Taster subscription.