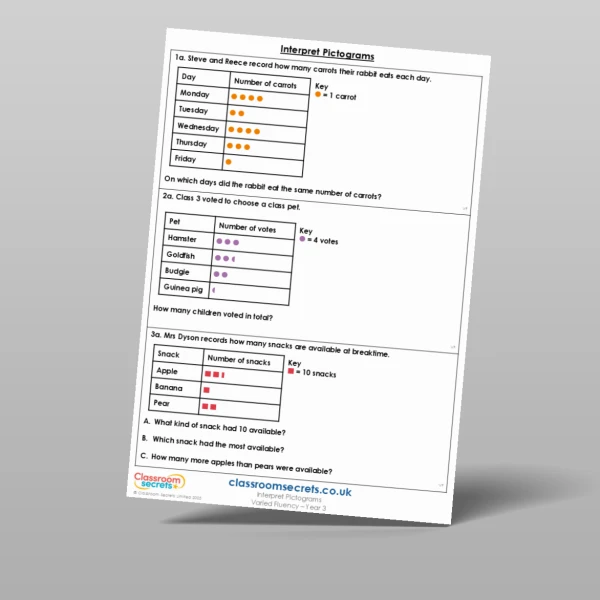
Develop children's understanding of statistics and collecting data with this Year 3 Interpret Pictograms Varied Fluency worksheet. There are six questions spread over two pages for pupils to complete including completing the totals, filling in the missing words and ticking the correct statement. All answers are provided to encourage peer and self-marking. Download now!
Curriculum Objectives
- Interpret and present data using bar charts, pictograms and tables
- Solve one-step and two-step questions [for example, ‘How many more?’ and ‘How many fewer?’] using information presented in scaled bar charts and pictograms and tables
Tags
Select a tag to view relevant resources
Summer
3S1
3S2
Statistics