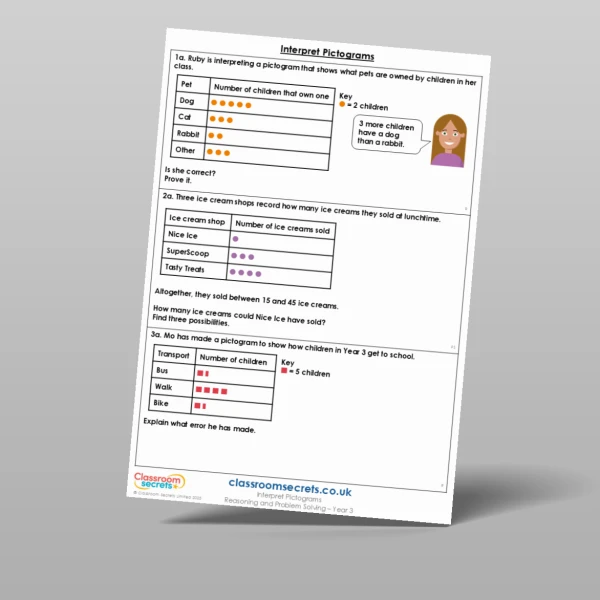
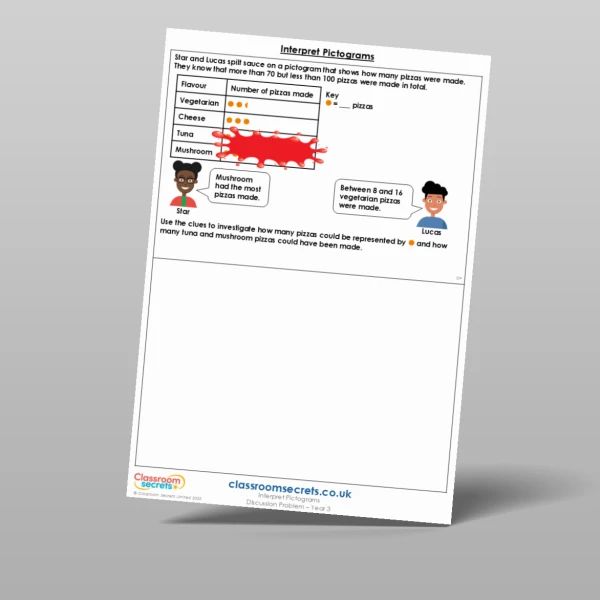
Children can apply their statistics skills with this Year 3 Interpret Pictograms Reasoning and Problem Solving worksheet. There are six questions with a range of contexts for pupils to complete including explaining if a statement is correct and using the clues to work out the missing data. All answers are provided to encourage peer and self-marking opportunities. Download today!
Curriculum Objectives
- Interpret and present data using bar charts, pictograms and tables
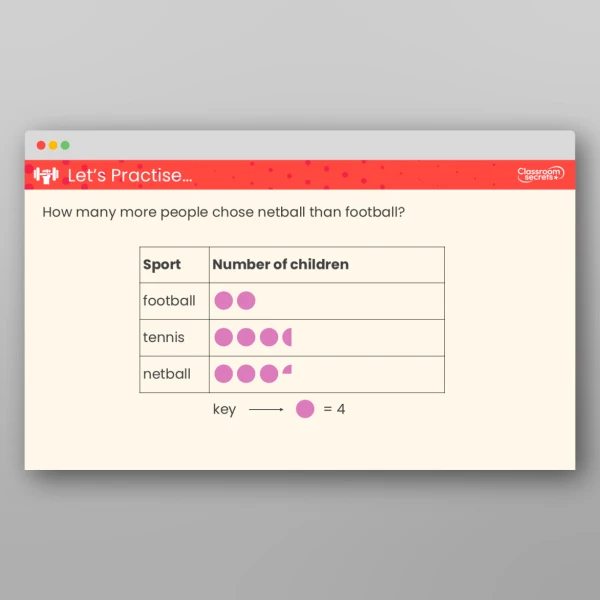
- Solve one-step and two-step questions [for example, ‘How many more?’ and ‘How many fewer?’] using information presented in scaled bar charts and pictograms and tables
Tags
Select a tag to view relevant resources
Summer
3S1
3S2
Statistics