Pupils can apply their understanding of statistics with this Year 3 Collect and Represent Data Using Pictograms Reasoning and Problem Solving worksheet. There are six questions over two pages which feature a range of engaging real-life contexts including explaining if a statement is correct and using the clues to complete the pictogram. Download now!
Curriculum Objectives
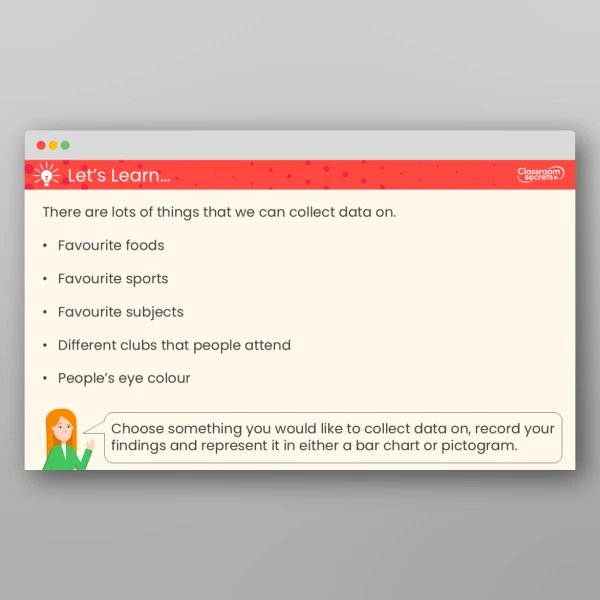
- Interpret and present data using bar charts, pictograms and tables
Tags
Select a tag to view relevant resources
Summer
3S1
Statistics