x1

Select a tag to view relevant resources
Summer
3S1
3S2
Statistics
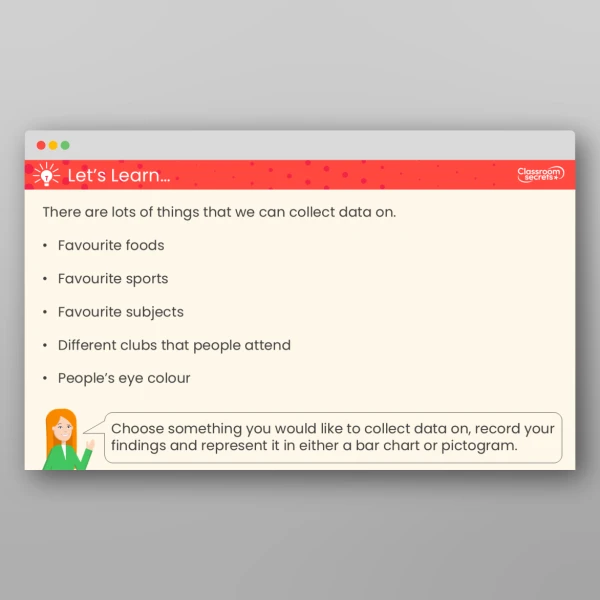
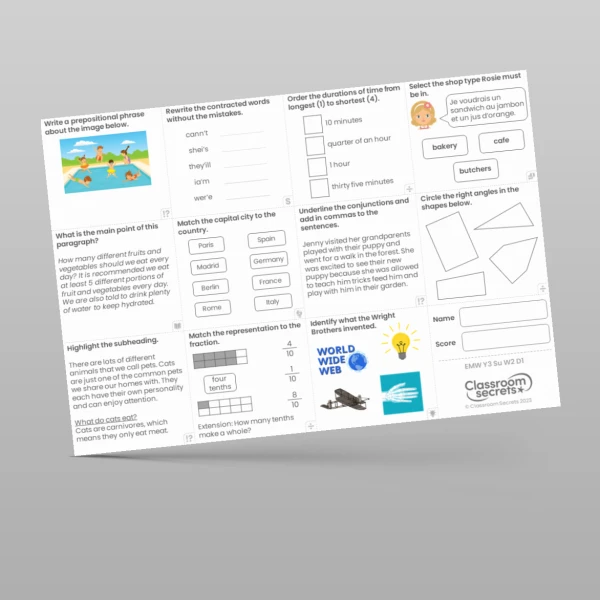
Year 3 Collect and Represent Data Homework is a worksheet to consolidate this step after it has been taught, at home or in class. The content includes two varied fluency questions, one problem solving question and a full answer sheet, covering collecting and representing data by drawing a bar chart, interpreting a bar chart and finding mistakes.
Our maths homework resources are not part of our adaptive maths resources, but they can be used alongside for consolidation purposes and to give children more opportunities to practise.
To teach this full step, head to Year 3 Collect and Represent Data lesson page.
This resource is designed to align to White Rose Maths version 3. Classroom Secrets Limited is not affiliated with, endorsed by, or in any way connected to White Rose Education Limited. Our products are original to Classroom Secrets Limited and any reference to White Rose Maths is solely for the purpose of indicating compatibility and does not imply any association with White Rose Education.
Select a tag to view relevant resources
Summer
3S1
3S2
Statistics