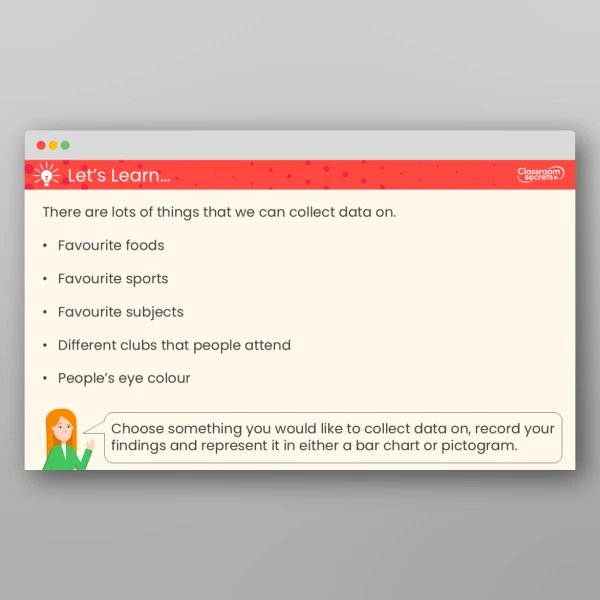
Try this Year 3 Collect and Represent Data Teaching PowerPoint to revisit tally charts, pictograms and bar charts.
The content is organised into Let’s Learn sections, where key concepts and mathematical language are clearly modelled, and Let’s Practise sections, where pupils can apply their learning through short, engaging activities.
It also includes reasoning and problem-solving questions to deepen understanding and provide opportunities for children to apply their knowledge in a range of contexts.
The final slide signposts further resources to support this small step – don’t forget to take a look!
This resource is designed to align to White Rose Maths version 3. Classroom Secrets Limited is not affiliated with, endorsed by, or in any way connected to White Rose Education Limited. Our products are original to Classroom Secrets Limited and any reference to White Rose Maths is solely for the purpose of indicating compatibility and does not imply any association with White Rose Education.
Curriculum Objectives
- Interpret and present data using bar charts, pictograms and tables
- Solve one-step and two-step questions [for example, ‘How many more?’ and ‘How many fewer?’] using information presented in scaled bar charts and pictograms and tables
Tags
Select a tag to view relevant resources
Statistics
Summer
3S1
3S2


