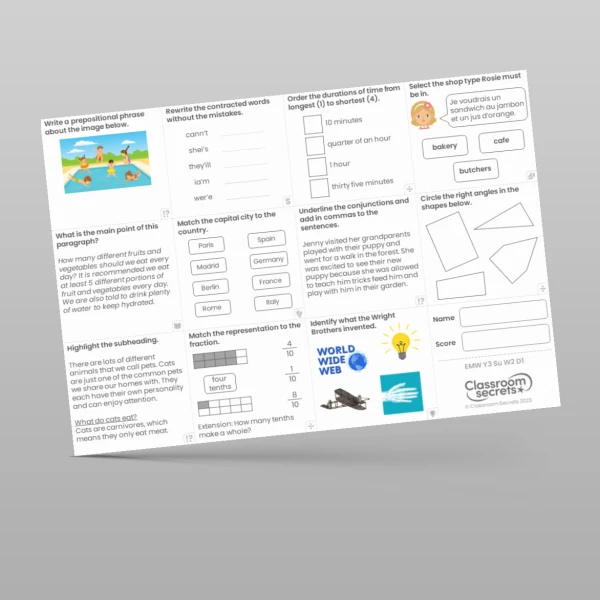

Children can practise their statistics skills with this Year 3 Collect and Represent Data Using Pictograms Fluency Matrix worksheet. There are six questions which gradually increase in the level of challenge to ensure learners are engaged and on-task throughout the lesson. We've provided the answers to encourage peer and self-marking opportunities. Why not follow-up this activity with our reasoning and problem-solving worksheet for the same step? Download now!
Curriculum Objectives
- Interpret and present data using bar charts, pictograms and tables
Tags
Summer
3S1
Statistics


