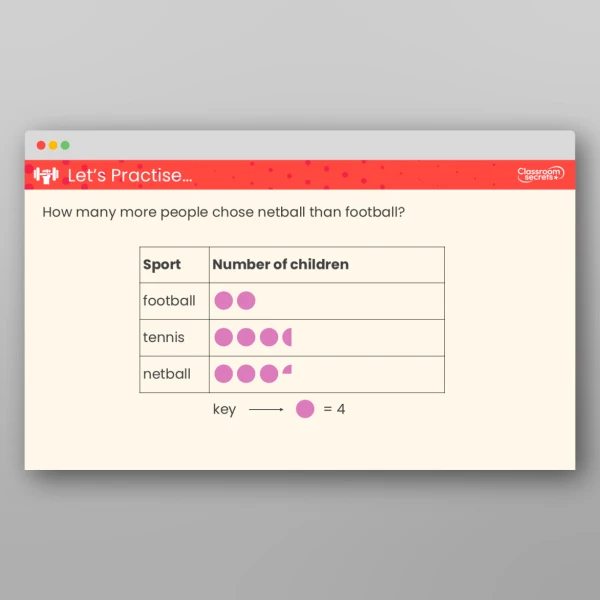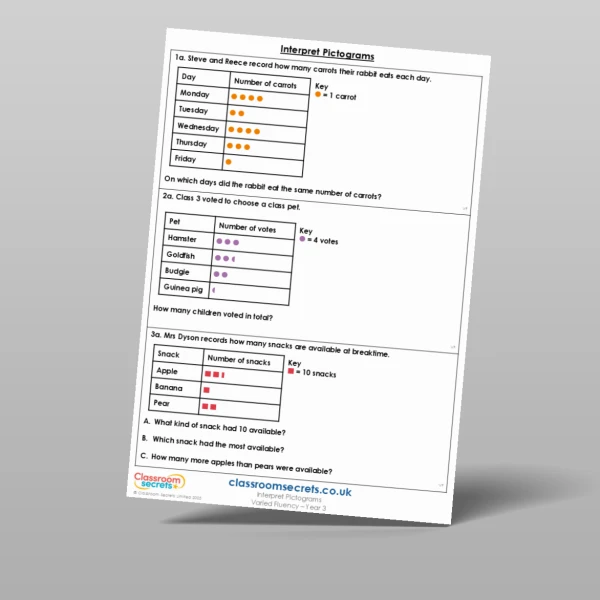
Consolidate understanding of how to interpret pictograms with this Year 3 Interpret Pictograms Varied Fluency resource.
Pupils using this worksheet will use their understanding of how to interpret pictograms to answer a range of questions. Children will solve one-step problems to familiarise themselves with interpreting data before moving onto two-step problems and finally multiple questions that relate to the same pictogram. All answers are provided for ease of marking!
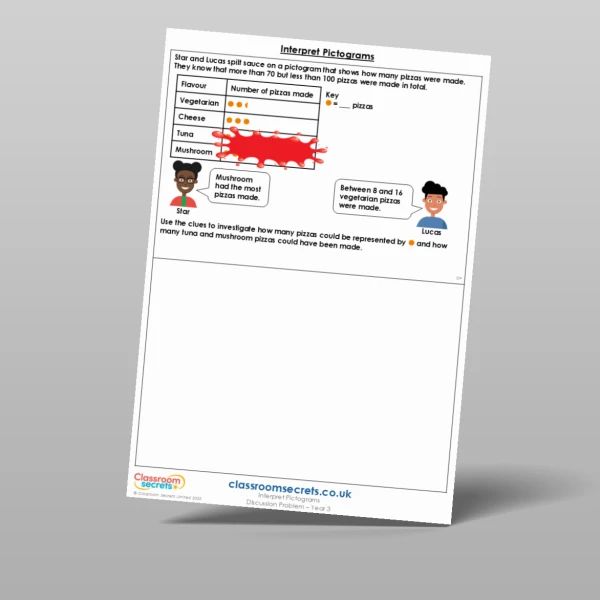
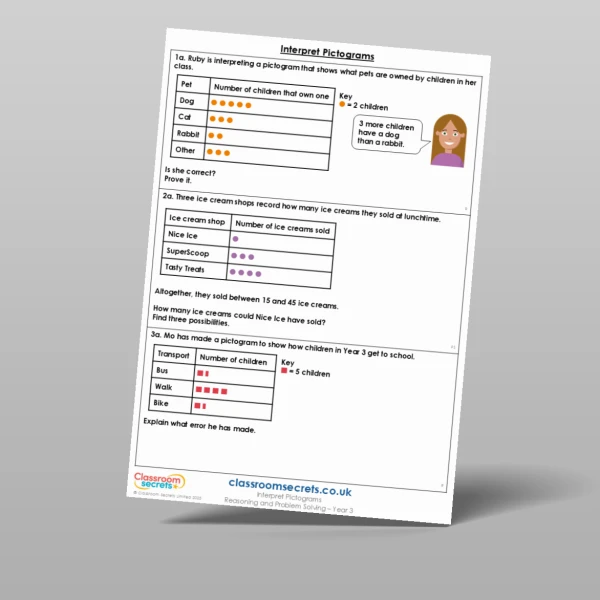
A reasoning and problem solving resource and discussion problem are also available for this small step.
This resource is designed to align to White Rose Maths version 3. Classroom Secrets Limited is not affiliated with, endorsed by, or in any way connected to White Rose Education Limited. Our products are original to Classroom Secrets Limited and any reference to White Rose Maths is solely for the purpose of indicating compatibility and does not imply any association with White Rose Education.
Curriculum Objectives
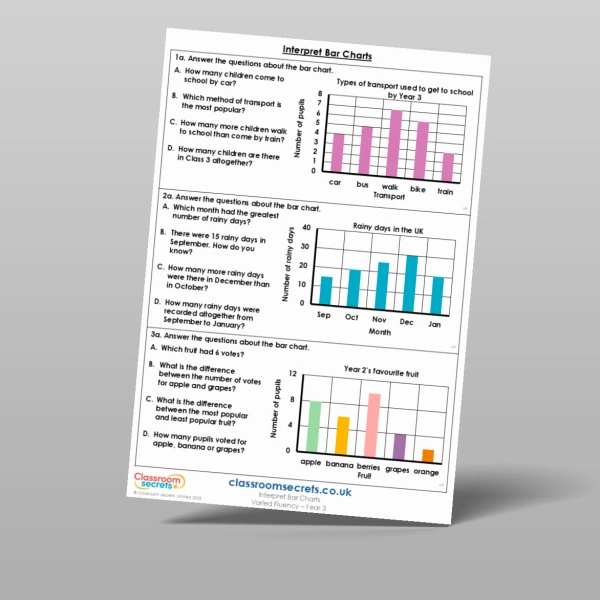
- Interpret and present data using bar charts, pictograms and tables
- Solve one-step and two-step questions [for example, ‘How many more?’ and ‘How many fewer?’] using information presented in scaled bar charts and pictograms and tables
Tags
Select a tag to view relevant resources
Statistics
Summer
3S1
3S2