Lesson 2: Understanding Our Pedestrian Survey Fieldwork PPT
PowerPoint
Practical
Teacher-led
Encourage children to further develop their geographical fieldwork skills with this LKS2 Understanding Our Pedestrian Survey Fieldwork PowerPoint.
Now that the pedestrian survey has been carried out in the previous lesson, Pedestrian Survey Geography Fieldwork PPT, Year 3 and Year 4 children will analyse the results in this lesson. After recapping key learning from the survey, they will look at how data in a tally chart can be turned into a bar chart and then turn their collected data into a bar chart. A bar chart framework is provided to be printed for ease of use.
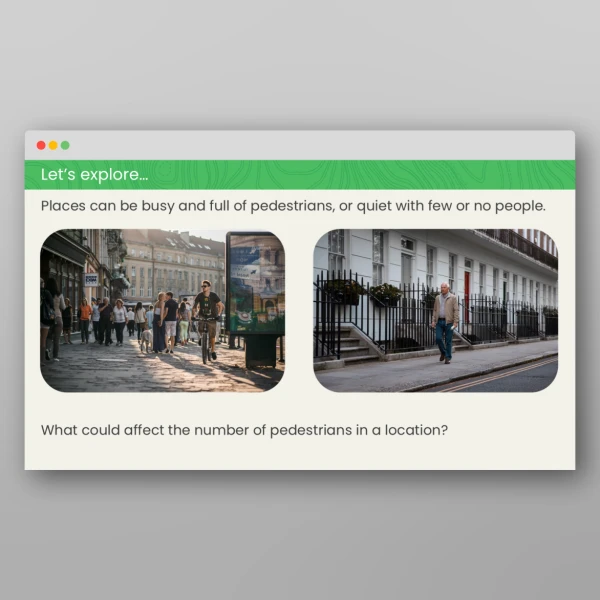
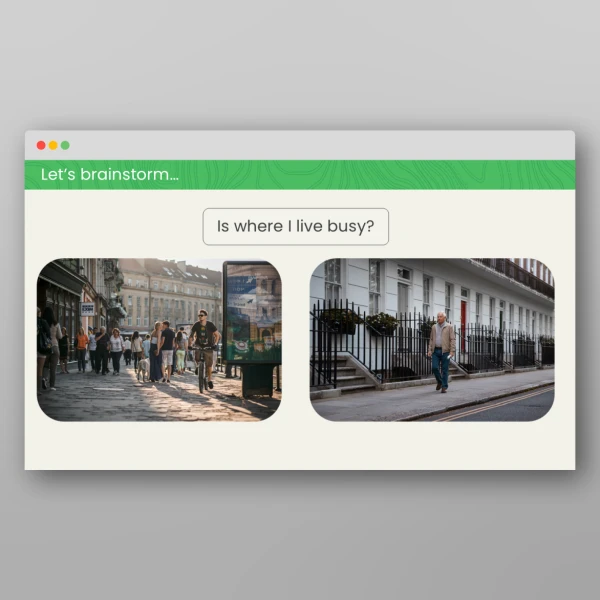
With oracy, discussion and prompts used to promote deeper learning, they will then analyse their results and draw conclusions, including what factors might make the results on the number of pedestrians different. Finally, they will consider how the pedestrian survey results would be different in a contrasting urban location.
Download today to help your children develop their data collection and fieldwork skills.
National Curriculum Objectives:
Use fieldwork to observe, measure, record and present the human and physical features in the local area using a range of methods, including sketch maps, plans and graphs, and digital technologies.
Tags
Select a tag to view relevant resources
Fieldwork