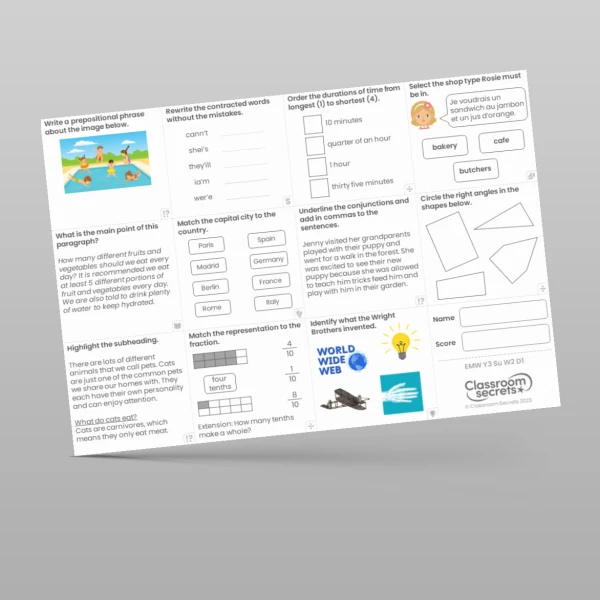

Develop pupils' understanding of statistics with this Year 3 Collect and Represent Data in Tally Charts (Recap) Varied Fluency worksheet. There are six questions for children to complete including filling in the missing totals and tallies, and matching the totals to the tally chart. All answers are provided to encourage peer and self-assessment. Why not follow-up this activity with our reasoning and problem-solving worksheet for this lesson? Download now!
Curriculum Objectives
- Interpret and present data using bar charts, pictograms and tables
Tags
Summer
3S1
Statistics


