Block Diagrams Year 2 Statistics Resource Pack

Step 6: Block Diagrams Year 2 Resources
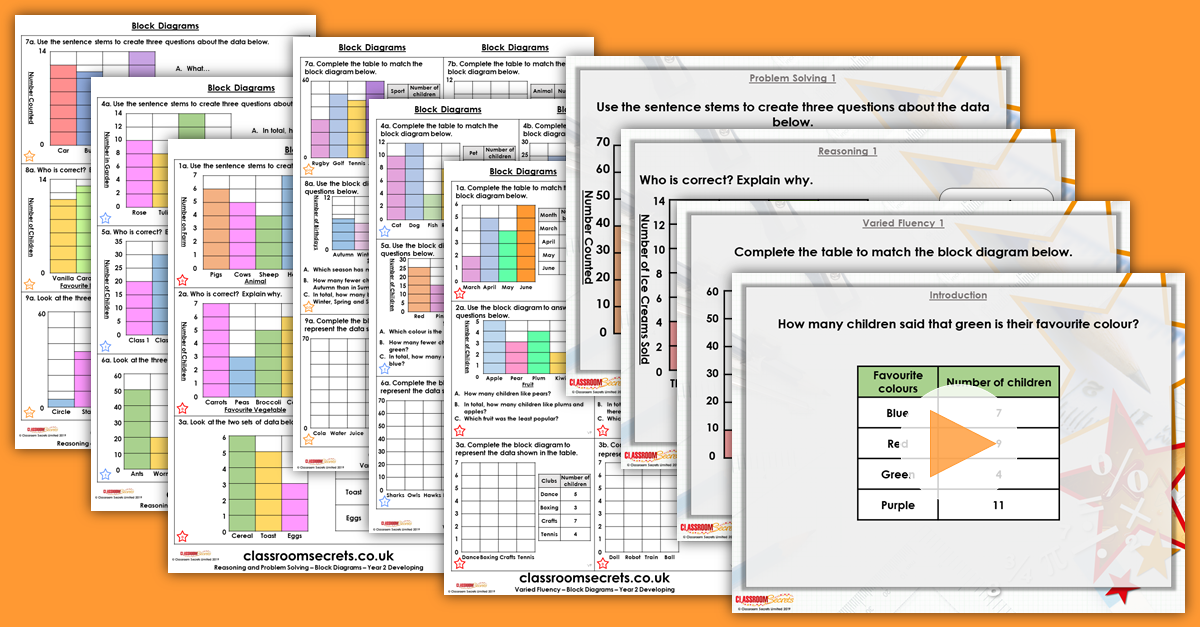
Block Diagrams Year 2 Resource Pack includes a teaching PowerPoint and differentiated varied fluency and reasoning and problem solving resources for Spring Block 2.


Not a member? Sign up here.
What's included in the pack?
This pack includes:
- Block Diagrams Year 2 Teaching PowerPoint.
- Block Diagrams Year 2 Varied Fluency with answers.
- Block Diagrams Year 2 Reasoning and Problem Solving with answers.
National Curriculum Objectives
Mathematics Year 2: (2S1) Interpret and construct simple pictograms, tally charts, block diagrams and simple tables
Mathematics Year 2: (2S2a) Ask and answer simple questions by counting the number of objects in each category and sorting the categories by quantity
Mathematics Year 2: (2S2b) Ask and answer questions about totalling and comparing categorical data
Differentiation For Year 2 Block Diagrams:
Varied Fluency
Developing Questions to support constructing and interpreting block diagrams where each block represents 1. Questions refer to totalling and comparing data.
Expected Questions to support constructing and interpreting block diagrams where each block represents 2, 5 or 10. Questions refer to totalling and comparing data.
Greater Depth Questions to support constructing and interpreting block diagrams where each block represents 2, 5 or 10, with some use of half blocks. Not all increments marked on the scale. Questions refer to totalling and comparing data.
Reasoning and Problem Solving
Questions 1, 4 and 7 (Problem Solving)
Developing Use the stem sentences to create questions about the block diagram. Each block represents 1 and question stems refer to totalling and comparing data.
Expected Use the stem sentences to create questions about the block diagram. Each block represents 2, 5 or 10 and question stems refer to totalling and comparing data.
Greater Depth Use the stem sentences to create questions about the block diagram. Each block represents 2, 5 or 10, with some half blocks used. Question stems refer to totalling and comparing data. Not all increments are marked on the scale.
Questions 2, 5 and 8 (Reasoning)
Developing Explain which statement about the block diagram is correct. Each block represents 1 and statements refer to totalling and comparing data.
Expected Explain which statement about the block diagram is correct. Each block represents 2, 5 or 10 and statements refer to totalling and comparing data.
Greater Depth Explain which statement about the block diagram is correct. Each block represents 2, 5 or 10, with some half blocks used. Statements refer to totalling and comparing data. Not all increments are marked on the scale.
Questions 3, 6 and 9 (Reasoning)
Developing Explain what is the same and what is different between two different charts. In block diagrams, each block represents 1.
Expected Explain what is the same and what is different between three different charts. In block diagrams, each block represents 2, 5 or 10.
Greater Depth Explain what is the same and what is different between different charts. In block diagrams, each block represents 2, 5 or 10, with some half blocks used. Not all increments are marked on the scale.
This resource is available to download with a Premium subscription.