Draw Pie Charts Homework Extension Year 6 Statistics
Step 7: Draw Pie Charts Homework Extension Year 6 Summer Block 3
Draw Pie Charts Homework Extension provides additional questions which can be used as homework or an in-class extension for the Year 6 Draw Pie Charts Resource Pack. These are differentiated for Developing, Expected and Greater Depth.
More resources for Summer Block 3 Step 7.


Not a member? Sign up here.
What's included in the pack?
This pack includes:
- Draw Pie Charts Homework Extension with answers for Year 6 Summer Block 3.
National Curriculum Objectives
Mathematics Year 6: (6S1) Interpret and construct pie charts and line graphs and use these to solve problems
Differentiation:
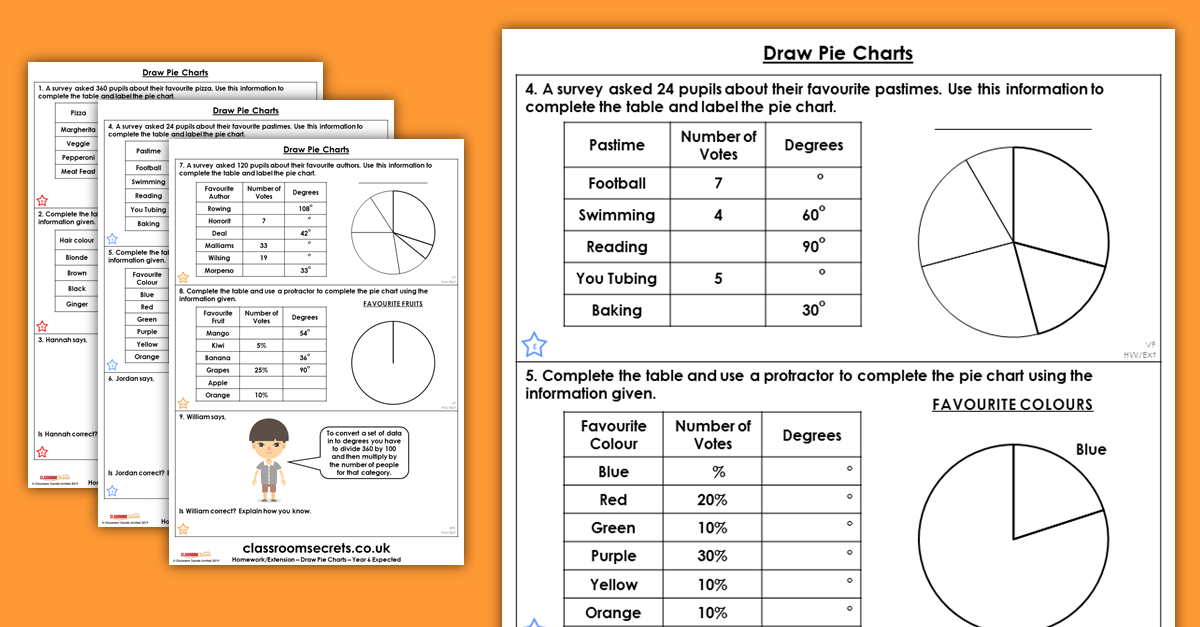
Questions 1, 4 and 7 (Varied Fluency)
Developing Complete the missing information in the table where 1 child represents 1o. Use the table to label the pie chart correctly.
Expected Complete the missing information in the table and label the pie chart using a total number divisible by 6. Use the table to label the pie chart correctly.
Greater Depth Complete the missing frequency and degrees in the chart and label the pie chart where the total number is divisible by a factor of 360. Use the table to label the pie chart correctly.
Questions 2, 5 and 8 (Varied Fluency)
Developing Complete the table and use the data to complete the pie chart using a protractor. Data totals 36 degrees.
Expected Complete the table and use the data to create a pie chart using a protractor. Percentages are in multiples of 10.
Greater Depth Complete the table and use the data to create a pie chart using a protractor. Percentages are in multiples of 5.
Questions 3, 6 and 9 (Reasoning and Problem Solving)
Developing Explain if a statement is correct using their knowledge of converting data into degrees where the number totals 36.
Expected Explain if a statement is correct using their knowledge of converting data into degrees where the number is divisible by 6.
Greater Depth Explain if a statement is correct using their knowledge of converting data into degrees.
This resource is available to download with a Premium subscription.