Two Way Tables Year 5 Statistics Learning Video Clip
Step 5: Two Way Tables Year 5 Statistics Learning Video Clip
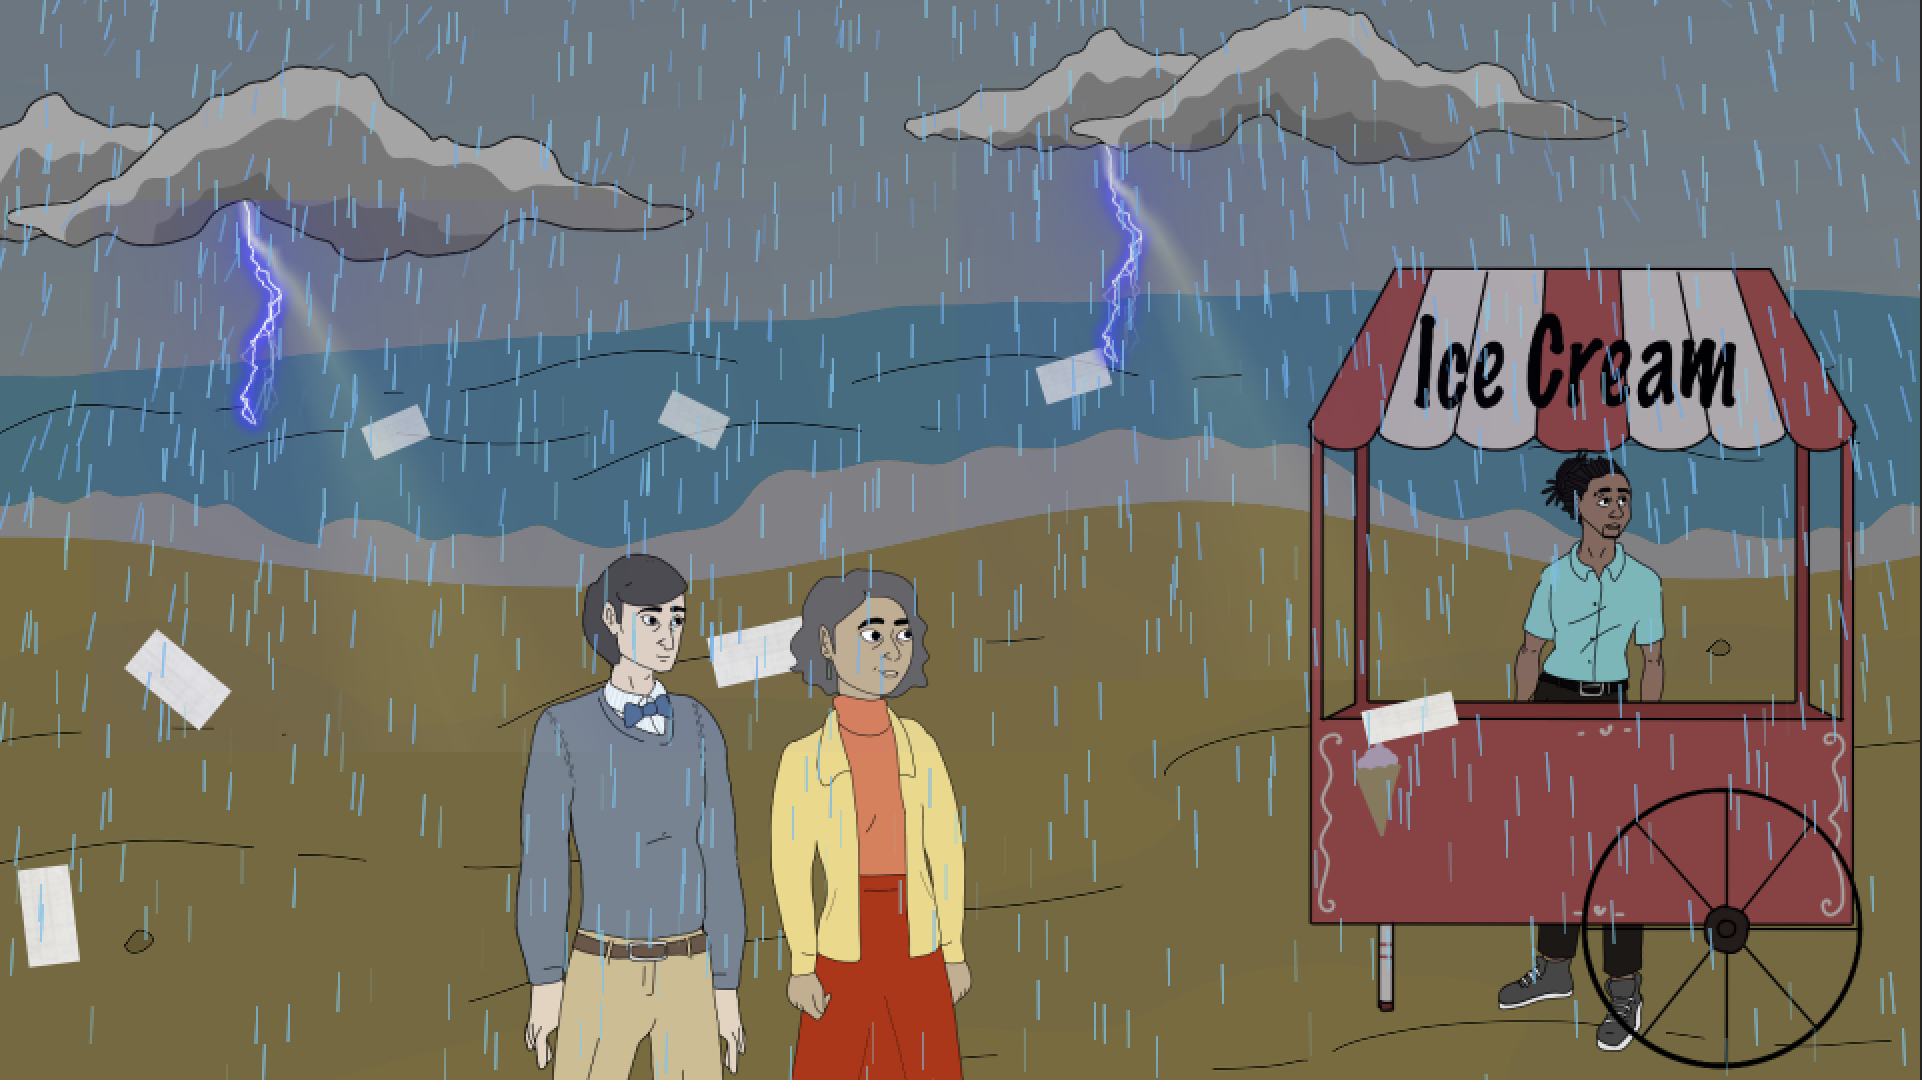
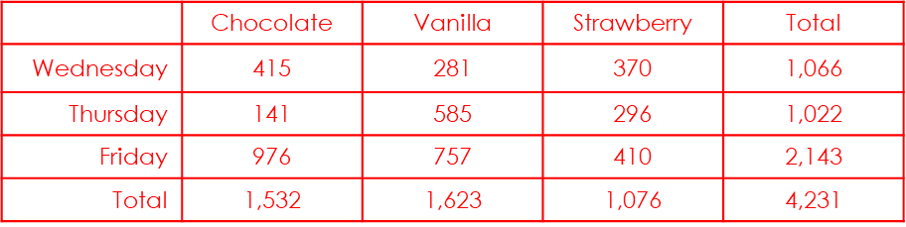
Coral and Sandy Shaw visit a rock pool, help an ice cream seller and work out some missing rainfall totals by completing and creating two way tables.
More resources for Autumn Block 3 Step 5.


Not a member? Sign up here.
Discussion points for teachers
1. How many more starfish were counted than cuttlefish across both rock pools?
Discuss how to find the missing values and the required calculation to compare the values.
5 (114 – 109)
2. Whose rock pool contains more wildlife?
Discuss how to find the whole total of each data set.
Sandy’s rock pool. (271 > 260)
3. Create a two way table to show the data.
Discuss how to set out the information in a table, including the required columns and rows.
4. Sandy and Coral went to the wettest beach on Friday. Which beach did they visit?
Discuss how to order the information given.
Land’s End
5. The forecast for Saturday has not been completed. Predict what the rainfall could be, based on Saturday’s totals.
Discuss how to find the total for Saturday based on the overall total and then how to use this to predict rainfall for each beach. This question is open-ended for children to explore.
Saturday in St Ives must equal 7.3. For other values, various answers, for example:

National Curriculum Objectives
Mathematics Year 5: (5S1) Complete, read and interpret information in tables, including timetables
This resource is available to play with a Premium subscription.